MATIC Price Prediction: Can Polygon Recover From The Recent Crash?
MATIC price is down over 15% and tested the $0.5150 support. Polygon is slowly recovering, but the bears might be active near $0.5650 and $0.5720. MATIC price started a fresh decline from the $0.6285 resistance zone agai...

MATIC price is down over 15% and tested the $0.5150 support. Polygon is slowly recovering, but the bears might be active near $0.5650 and $0.5720.
- MATIC price started a fresh decline from the $0.6285 resistance zone against the US dollar.
- The price is trading below $0.570 and the 100-hour simple moving average.
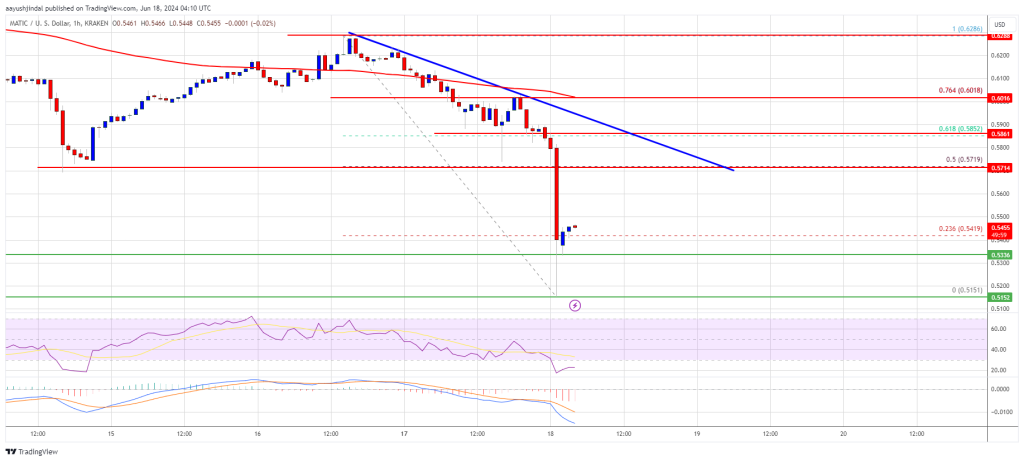
- There is a key bearish trend line forming with resistance at $0.5720 on the hourly chart of the MATIC/USD pair (data source from Kraken).
- The pair could recover and test the $0.5720 resistance zone in the near term.
After a decent increase, Polygon’s price faced heavy resistance near the $0.6285 zone. MATIC formed a short-term top at $0.6286 and recently started a fresh decline like Bitcoin and Ethereum.
There was a sharp move below the $0.600 and $0.5720 support levels. The price even dipped below $0.5250 and tested $0.5150. A low was formed at $0.5151 and the price is now attempting to recover. There was a move above the $0.5350 resistance level.
The price climbed above the 23.6% Fib retracement level of the downward move from the $0.6286 swing high to the $0.5151 low. MATIC is trading below $0.560 and the 100 simple moving average (4 hours).
Immediate resistance is near the $0.5550 zone. The first major resistance is near the $0.5720 level or the 50% Fib retracement level of the downward move from the $0.6286 swing high to the $0.5151 low. There is also a key bearish trend line forming with resistance at $0.5720 on the hourly chart of the MATIC/USD pair.
If there is an upside break above the $0.5720 resistance level, the price could continue to rise. The next major resistance is near $0.5850. A clear move above the $0.5850 resistance could start a steady increase. In the stated case, the price could even attempt a move toward the $0.6285 level or $0.650.
Another Decline in MATIC?If MATIC’s price fails to rise above the $0.5720 resistance level, it could start another decline. Immediate support on the downside is near the $0.5320 level.
The main support is near the $0.5150 level. A downside break below the $0.5150 level could open the doors for a fresh decline toward $0.50. The next major support is near the $0.4850 level.
Technical Indicators
Hourly MACD – The MACD for MATIC/USD is gaining momentum in the bearish zone.
Hourly RSI (Relative Strength Index) – The RSI for MATIC/USD is now below the 30 level.
Major Support Levels – $0.5320 and $0.5150.
Major Resistance Levels – $0.5600, $0.5720, and $0.5850.
Original source
Read on NewsBTCRelated market context

Standard Chartered Says Bitcoin Bottomed Near $59,000 As Crypto Winter Ends
TL;DR Standard Chartered’s Geoffrey Kendrick reportedly says Bitcoin’s $59,000 area marked the cycle bottom. The note cites SpaceX...

Bitcoin Mining Cost Model Points To $47,000 Floor, But Analysts Urge Caution
TL;DR Crypto Rover says Bitcoin has never bottomed below electrical production cost, currently estimated at $47,000. Mining-cost m...

Are 24/7 CME Bitcoin futures a volatility cure — or a new leverage trap?
Wall Street got to trade Bitcoin around the clock just in time to watch the market fall apart. CME Group launched 24/7 trading for...

Bitcoin price faces new risk as big buyers lose conviction
Bitcoin’s largest buyers are no longer behaving like a reliable backstop for the largest cryptocurrency. The exchange-traded funds...

Bitcoin rises above $64,000 after Pakistan prime minister says Iran peace deal is near
Bitcoin traded above $64,000 on Saturday, supported by its strongest ETF inflows in a month and growing optimism around geopolitic...

Bitcoin faces one of its biggest mining difficulty drops as miner margins collapse
The Bitcoin network is poised to execute one of the largest downward adjustments to its mining difficulty in its 17-year history t...