Polygon’s MATIC Price Prediction: Why Bulls Aim $1 or Higher
MATIC price started a steady increase from the $0.720 support zone. Polygon buyers might now aim a push towards the key $1.00 resistance. MATIC price is gaining pace above the $0.80 level against the US dollar. The price...

MATIC price started a steady increase from the $0.720 support zone. Polygon buyers might now aim a push towards the key $1.00 resistance.
- MATIC price is gaining pace above the $0.80 level against the US dollar.
- The price is trading well above $0.800 and the 100 simple moving average (4-hours).
- There was a break above a major bearish trend line with resistance at $0.810 on the 4-hours chart of the MATIC/USD pair (data source from Kraken).
- The pair could continue to rise and might soon test the $1.00 resistance zone.
After a major decline, polygon’s price found support near the $0.720 zone. MATIC price formed a base above the $0.720 level and started a steady increase.
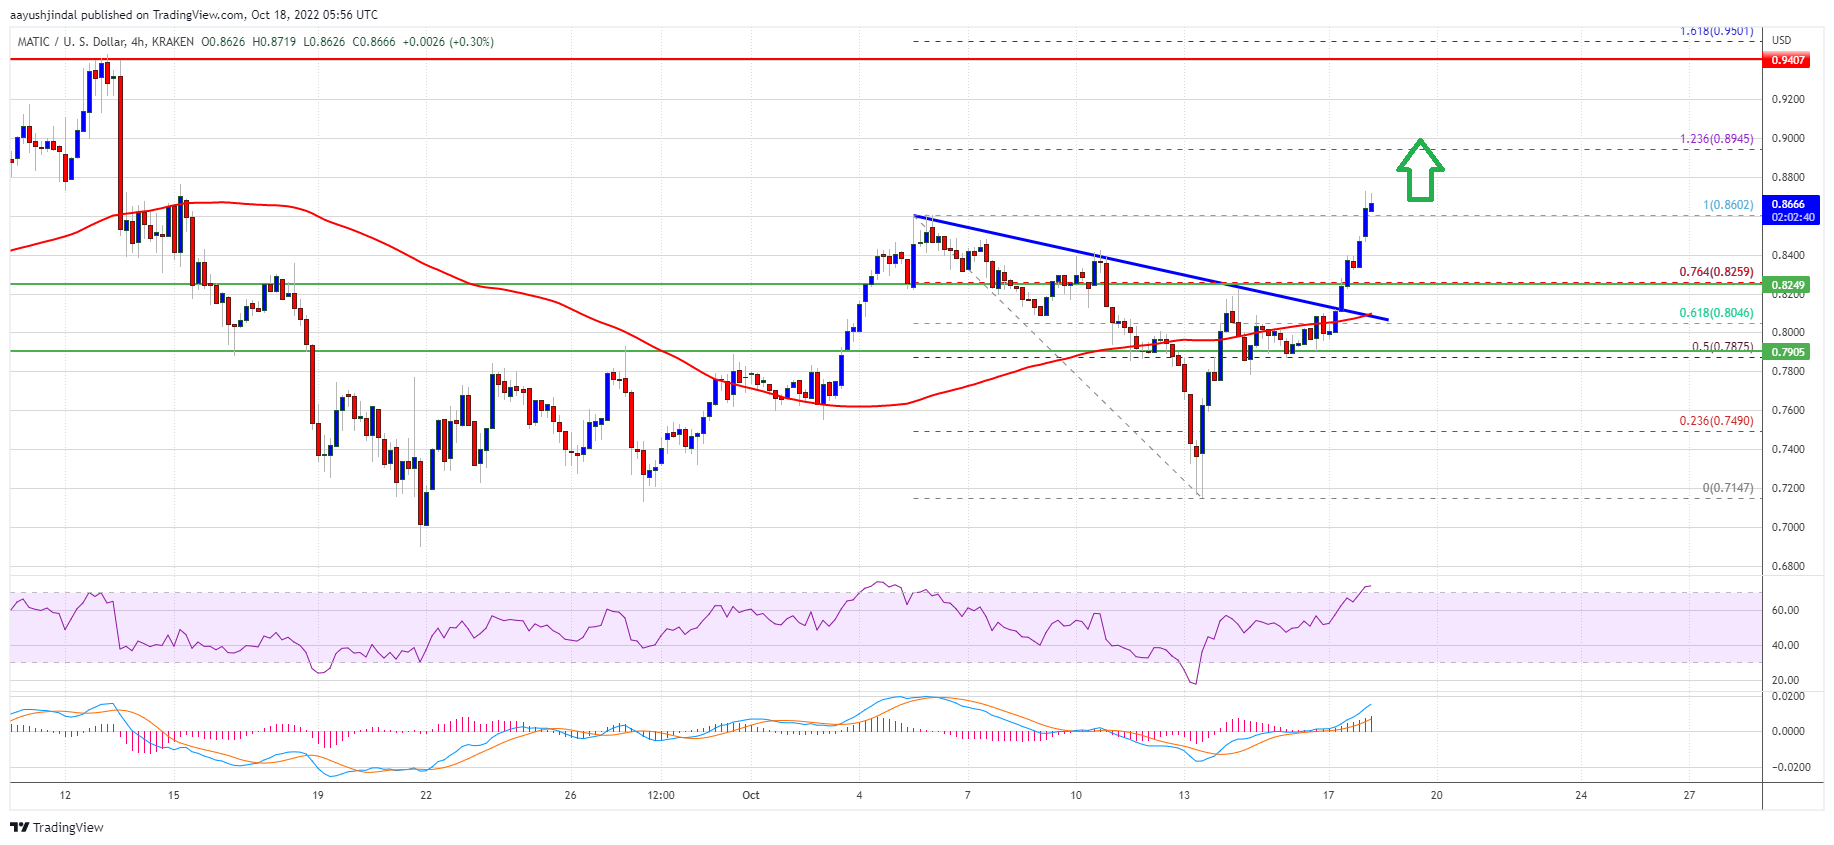
There was a clear move above the $0.755 and $0.788 resistance levels. The price climbed above the 50% Fib retracement level of the downward move from the $0.8602 swing high to $0.7147 low. There was also a break above a major bearish trend line with resistance at $0.810 on the 4-hours chart of the MATIC/USD pair.
The price is now trading well above $0.800 and the 100 simple moving average (4-hours). It is also showing positive signs above the last swing high at $0.8602, just like bitcoin and ethereum.
On the upside, an immediate resistance is near the $0.895 zone. The first major resistance is forming near the $0.950 zone. It is close to the 1.618 Fib extension level of the downward move from the $0.8602 swing high to $0.7147 low.
Source: MATICUSD on TradingView.com
The main resistance is now forming near the $1.000 level. If there is an upside break above the $0.950 and $1.00 resistance levels, the price could start a strong increase. In the stated case, the price could rise steadily towards the $1.12 level.
Fresh Decline in MATIC?If MATIC price fails to continue higher above the $0.90 or $0.95 levels, it could start a downside correction. An immediate support on the downside is near the $0.840 level.
The main support is near the $0.800 level and the 100 simple moving average (4-hours). A downside break below the $0.800 level could open the doors for a fresh decline towards $0.750. The next major support is near the $0.720 level.
Technical Indicators
4-hours MACD – The MACD for MATIC/USD is slowly gaining momentum in the bullish zone.
4-hours RSI (Relative Strength Index) – The RSI for MATIC/USD is now above the 50 level.
Major Support Levels – $0.840 and $0.800.
Major Resistance Levels – $0.900, $0.950 and $1.00.
Original source
Read on NewsBTCRelated market context

Bitcoin price challenges $64,000 weekend wall – needing a breakout or risk a deeper correction
Bitcoin reclaimed $64,000 on June 12 and touched an intraday high of $64,301 in the same session that spot ETF flows finally flipp...

Bitcoin Mining Cost Model Points To $47,000 Floor, But Analysts Urge Caution
TL;DR Crypto Rover says Bitcoin has never bottomed below electrical production cost, currently estimated at $47,000. Mining-cost m...

Bitcoin rises above $64,000 after Pakistan prime minister says Iran peace deal is near
Bitcoin traded above $64,000 on Saturday, supported by its strongest ETF inflows in a month and growing optimism around geopolitic...

Standard Chartered Says Bitcoin Bottomed Near $59,000 As Crypto Winter Ends
TL;DR Standard Chartered’s Geoffrey Kendrick reportedly says Bitcoin’s $59,000 area marked the cycle bottom. The note cites SpaceX...

XRP Price Prediction: Japan XRP ETF Listing is Getting Closer
Japan just handed XRP bulls a major regulatory tailwind. XRP price is retesting a congestion zone, and the prediction could turn b...

Are 24/7 CME Bitcoin futures a volatility cure — or a new leverage trap?
Wall Street got to trade Bitcoin around the clock just in time to watch the market fall apart. CME Group launched 24/7 trading for...