Stellar (XLM) Chart Signals Major Rally —Is A 330% Surge Coming?
The Stellar (XLM) market has registered a price boost in the past day gaining by 10.77% according to data from CoinMarketCap. This price bounce comes after a rather bearish week marked by significant losses across the ge...
Archive context
Older archive item. Useful for background and entity history, but not a fresh market-moving signal.

The Stellar (XLM) market has registered a price boost in the past day gaining by 10.77% according to data from CoinMarketCap. This price bounce comes after a rather bearish week marked by significant losses across the general crypto market. Interestingly, as these digital assets show some minor recovery, renowned market analyst Ali Martinez has postulated that XLM may be preparing for a major bullish swing.
XLM’s Bullish Flag Could Propel Prices To $1.20 – AnalystIn an X post on March 1, Martinez shared an interesting technical analysis of the XLM market. According to the market expert, there is a bullish flag formation on the XLM/USDT 3-day trading chart signaling an incoming price surge.
For context, the bullish flag pattern occurs when an asset experiences a steep rise in price representing the flagpole followed by a consolidation period with a declining price movement representing the flag. On the XLM/USDT chart, the bullish flag is formed following a price rally in November 2024 which is trailed by a price correction phase to date.
However, while the bullish flag might signal a potential upward momentum ready to explode, Stellar must break beyond the upper boundary of the flag currently at $0.41 to confirm any price surge. Looking beyond this level, the altcoin will also face significant resistance to its upward movement at $1.00, $1.21, and $1.41 price levels respectively.
However, in the presence of sufficient buying pressure, XLM could surge by at least 330% upon confirmation of bullish intent suggesting a minimum price of around $1.20. This projected rise of Stellar stems from historical data from which a bullish flag is expected to produce market gains similar to the length of its flagpole.
Interestingly, the Relative Strength Index (RSI) on the XLM/USDT daily chart also supports the bullish potential of the altcoin. According to data from Tradingview, this RSI is currently at 4.59 headed in the upward direction, signaling more room for XLM price gains following its recent recovery.
XLM Price OverviewAt the time of writing, XLM trades at $0.3141 after its 10% price increase in the last 24 hours as earlier stated. Meanwhile, there is a slight reduction in market engagement as indicated by a 1.12% decline in daily trading volume.
It is worth noting that XLM still remains in the red zone on its weekly and monthly timeframes with losses of 5.94% and 27.28%, respectively suggesting larger bearish market control in recent times. For a bullish flag breakout to materialize, XLM traders must increase the current buying pressure and induce a higher trading volume.
Why this matters
This cryptocurrency story adds another data point to the current market tape and is useful when read alongside nearby source coverage.
Original source
Read on NewsBTCRelated market context

Why Bitcoin’s rally is dangerous according to new Fed data
Bitcoin’s rally and the Federal Reserve’s new financial-risk gauge describe two different time horizons. BTC reflects demand and p...

XRP Price Today: XRP Hits $1.60 as Heavy Whale Accumulation Points to a $2 Rally and Beyond
The XRP price reached $1.6060 on September 23 after opening near $1.5808, according to historical market data. The token subsequen...
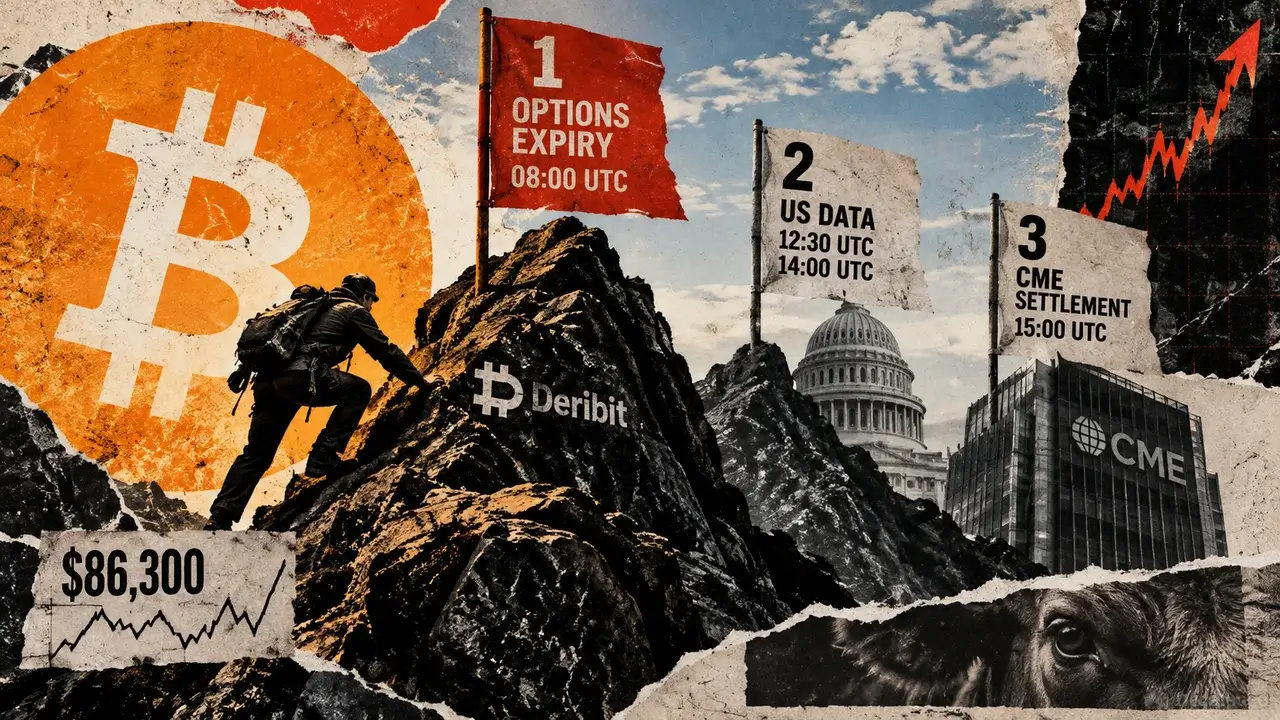
Bitcoin faces $16 billion options expiry Friday, then two more tests hit the rally
Bitcoin options carrying roughly $16 billion in notional value expire on Deribit at 08:00 UTC on Friday, Sept. 25. Calls account f...

Marex expands crypto trading through Bullish partnership
The partnership could streamline institutional crypto trading, enhancing market efficiency and potentially increasing institutiona...

Solana’s tokenized commodities surge to $87M weekly volume as Raydium dominates trading
Solana's rise in tokenized commodities trading highlights its growing influence in DeFi, challenging Ethereum's dominance in the s...

ETH USD Loses Ground as Ethereum Price Analysis Remains Targeting $3,000 This Week
Ethereum Price Prediction, September 23: Ethereum (ETH) trades at $2,735, down a marginal 0.61% over the past 24 hours, a pause, n...