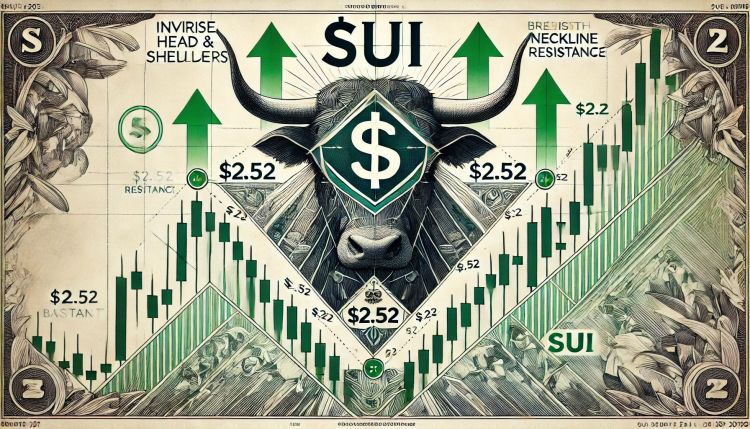
SUI Forms Inverse Head And Shoulders – Can Bulls Break Above $2.52?
SUI is currently down 56% from its January all-time high, consolidating around a key support level as the broader market battles ongoing volatility and selling pressure. Like much of the crypto space, SUI has been hit ha...
Archive context
Older archive item. Useful for background and entity history, but not a fresh market-moving signal.
SUI is currently down 56% from its January all-time high, consolidating around a key support level as the broader market battles ongoing volatility and selling pressure. Like much of the crypto space, SUI has been hit hard by global macroeconomic uncertainty and investor risk aversion, leading many analysts to expect a continuation of the downtrend. With both traditional and crypto markets under pressure, bearish sentiment continues to dominate headlines.
Despite the negative outlook, some analysts see early signs of a potential reversal forming. Top crypto analyst Ali Martinez shared a bullish observation, noting that SUI is showing an inverse head and shoulders pattern on a short-term time frame — a technical formation often associated with a shift in momentum and a possible upward breakout.
While the overall trend remains fragile, the emergence of this bullish structure may suggest a short-term rebound is possible — if confirmed. For now, traders are watching closely to see whether this pattern will hold and ignite a rally or if broader market weakness will continue to drag SUI lower.
SUI Holds Support As Bullish Pattern Forms Amid Market TurmoilSUI continues to face selling pressure as global markets react to heightened economic uncertainty. The latest wave of volatility followed U.S. President Donald Trump’s announcement of new tariffs on what he declared “Liberation Day,” rattling investor confidence across both traditional and crypto markets. Risk assets, including altcoins like SUI, have been particularly vulnerable to these geopolitical shocks.
Despite the turbulence, some analysts believe the worst may be over. They argue that the current environment could mark the beginning of a consolidation phase — a necessary reset before the next major move. SUI appears to reflect this dynamic, with price action tightening between two key levels. Bulls have struggled to push SUI above the $2.50 mark, a critical resistance zone that has held strong through recent attempts. At the same time, bears have failed to break the $2.20 level, indicating solid demand at lower prices.
Adding to the optimistic outlook, Martinez shared a bullish technical setup. According to his analysis, SUI has formed an inverse head and shoulders pattern — a classic reversal formation — on the short-term chart. If SUI can manage to decisively break above $2.52, this could trigger a short-term bullish reversal and open the door to further gains.
While macroeconomic headwinds remain strong, the formation of a reliable bullish pattern amid consolidation is a positive sign. Traders are now closely watching the $2.52 level, which could serve as the catalyst for the next big move. If confirmed, the breakout could mark the start of SUI’s recovery phase — even as broader markets remain on edge.
Price Action: Bulls Defend Key Support LevelsSUI is currently trading at $2.30 after spending the past month below both the 200-day moving average (MA) and exponential moving average (EMA). This prolonged weakness has kept the asset under pressure, with bulls struggling to regain momentum. The current price zone is critical, and holding above this level is essential to avoid further downside.
To initiate a meaningful recovery, bulls must push SUI higher and reclaim key resistance levels. The most important area to watch is the $2.85 mark, which aligns closely with the 200-day EMA. A breakout above this level would signal a potential trend reversal and could trigger renewed bullish momentum.
Until then, price action remains vulnerable. If bulls fail to reclaim the $2.85 zone in the coming sessions, SUI risks another leg down. The next major support lies around $2.00 — a level that could attract buyers but also marks the edge of a deeper correction if breached.
With market sentiment still uncertain, the next move will largely depend on whether bulls can defend current levels and overcome resistance. A failure to do so could extend the consolidation or lead to more downside in the near term.
Featured image from Dall-E, chart from TradingView
Why this matters
This cryptocurrency story adds another data point to the current market tape and is useful when read alongside nearby source coverage.
Original source
Read on NewsBTCRelated market context

XRP Price Prediction: SuperTrend Buy Signal Meets Shrinking Supply as $1.24 Breakout Comes Into Focus
After a fresh SuperTrend buy signal appeared on the 4-hour chart, analysts are watching whether the XRP price can extend its recen...

Reported Riot 500 BTC custody transfer exposes Bitcoin miners’ AI funding pressure
Riot Platforms' reported 500 BTC movement to NYDIG Custody gives the market a live signal for how public miners may use coin treas...

Ethereum returns to top 100 global assets as market cap climbs back above $215 billion
Ethereum's market cap recovery enhances its appeal to institutional investors, potentially boosting its role in decentralized fina...

XRP vs Bitcoin: Investor Says RLUSD Growth and Regulatory Clarity Could Shift Crypto’s Balance of Power
While the claim remains highly ambitious given Bitcoin’s commanding lead in market capitalization, the discussion highlights broad...
Bollinger Bands creator eyes Bitcoin bear-market end, 'W'-shaped reversal
Bitcoin price strength could "break" the entire downtrend if the reversal pattern completed, John Bollinger suggested in light of...

Bitcoin’s Freedom Money to set Independence day liquidity benchmark while Wall Street shuts down
Bitcoin keeps trading when Wall Street stops. Independence Day turns that design choice into a market demonstration. Official exch...