TON Price Surges 15% In A Day But Signs of Bullish Exhaustion Emerge
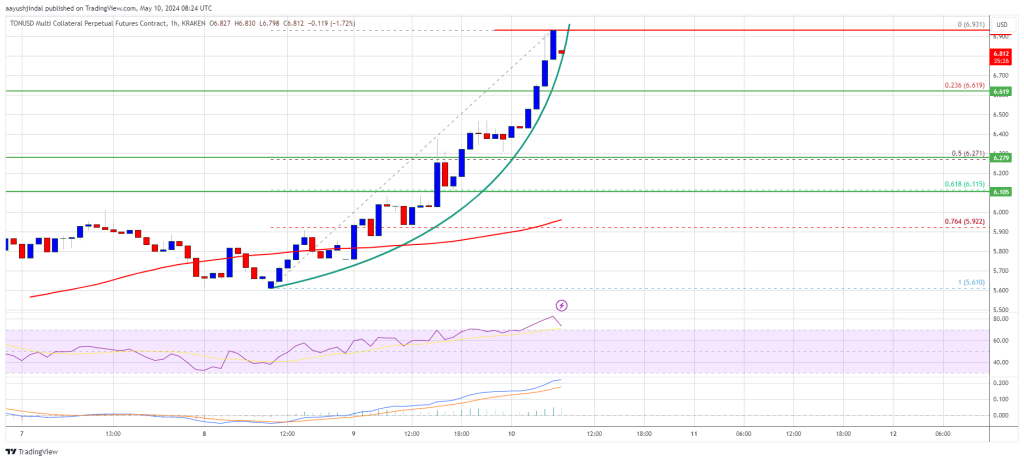
TON price rallied nearly 15% and traded above the $6.50 resistance. Toncoin is now showing a few signs of trend exhaustion and might correct gains. Toncoin jumped above the $6.20 and $6.50 resistance levels. The price is...

TON price rallied nearly 15% and traded above the $6.50 resistance. Toncoin is now showing a few signs of trend exhaustion and might correct gains.
- Toncoin jumped above the $6.20 and $6.50 resistance levels.
- The price is now trading above $6.50 and the 100-hourly Simple Moving Average.
- There is a key parabolic curve forming with support at $6.80 on the hourly chart of the TON/USD pair (data source from Kraken).
- The pair could start a downside correction if it declines below $6.80 and the $6.60.
Recently, TON price started a strong increase from the $5.60 support zone. It climbed above the $6.20 resistance zone. It gained nearly 15% in a day and outperformed Bitcoin and Ethereum.
Toncoin traded close to the $7.00 level. A high was formed at $6.93 and the price is now consolidating gains. It is trading near the $6.80 zone and well above the 100-hourly Simple Moving Average. There is also a key parabolic curve forming with support at $6.80 on the hourly chart of the TON/USD pair.
Immediate resistance is near the $6.92 level. The first key resistance is near $7.00. A close above the $7.00 resistance zone could spark a strong increase.
Source: TONUSD on TradingView.com
The next key resistance is near $7.20. If the bulls remain in action above the $7.20 resistance level, there could be a rally toward the $7.55 resistance. Any more gains might send the price toward the $8.00 resistance.
Downside Correction In Toncoin?If Toncoin price fails to clear the $6.90 resistance zone, it could start a downside correction. Initial support on the downside is near the $6.80 level and the parabolic curve, below which the price might test the 23.6% Fib retracement level of the upward move from the $5.61 swing low to the $6.93 high.
The next major support is at $6.25 or the 50% Fib retracement level of the upward move from the $5.61 swing low to the $6.93 high. If there is a downside break and a close below the $6.25 level, the price might accelerate lower. In the stated case, the price could retest the $6.00 support zone.
Technical Indicators
Hourly MACD – The MACD for TON/USD is now losing pace in the bullish zone.
Hourly RSI (Relative Strength Index) – The RSI for TON/USD is now above the 70 level.
Major Support Levels – $6.80 and $6.60.
Major Resistance Levels – $6.90 and $7.00.
Original source
Read on NewsBTCRelated market context

Dogecoin (DOGE) Recovery Gains Traction—Can It Unlock Bigger Gains?
Dogecoin started a fresh increase from the $0.0850 zone against the US Dollar. DOGE is now facing hurdles near $0.090 and might ai...

Bitcoin Stabilizes Near Key Zone, But Glassnode Warns Capital Flows Remain Weak
Bitcoin’s rebound from the $60,000 area has given bulls something to work with, but Glassnode’s latest market read suggests the re...

Ethereum Price Prediction: ETH is Still Below Its 200 Week SMA, and Tom Lee Buying Spree Might End Soon
Ethereum price is trading above $1,700 after running for 5% today, and even our prediction model is calling for more leg higher. H...

XRP Price Next Chapter Could Be A Strong Move To The Upside
XRP price started a steady increase above $1.1650. The price is now consolidating gains and might aim for more gains above the $1....
Ethereum News: Last Chance to Buy Ethereum Under $2K? ETH USD Powers Up After Hormuz Peace Deal
In the latest Ethereum News, Ethereum ETH Price is trading at $1,739 up 4% in 24 hours, as risk assets catch a bid following the H...

XRP Price Analysis: Ripple Token Eyes 10% Gain with Flashing Bullish Pattern and ETF Inflows
XRP price posts 9% moves today from low $1.1 to $1.24, with a prediction that it could go even higher. Two independent tailwinds a...