Toncoin Under Pressure As TON Price Falls Below 100-Day SMA, $6 Looms
Toncoin (TON) has recently seen a notable price decline, dropping below its 100-day Simple Moving Average (SMA). This breach of a critical technical indicator has placed the digital asset under bearish pressure, raising...
Archive context
Older archive item. Useful for background and entity history, but not a fresh market-moving signal.

Toncoin (TON) has recently seen a notable price decline, dropping below its 100-day Simple Moving Average (SMA). This breach of a critical technical indicator has placed the digital asset under bearish pressure, raising concerns among investors and traders. With the $6 mark now looming as a potential target, there is market speculation about whether the price will continue to decline or if a possible recovery could occur.
This article aims to inform readers about the potential implications of Toncoin’s recent technical breach by providing an in-depth analysis of its market performance, specifically focusing on the price falling below the 100-day SMA. It also assesses possible future scenarios for TON’s price movement, exploring whether the digital asset will continue to decline toward the $6 mark or if a recovery might be imminent.
At the time of writing, the price of Toncoin was trading around $6.75, up by 2%, with a market capitalization of over $16 billion and a trading volume exceeding $220 million. Over the last 24 hours, there has been a 2.01% increase in TON’s market capitalization, while its trading volume has decreased by 14.75%.
Breaking Below The 100-Day SMA: A Technical AnalysisAfter successfully crossing below the 100-day Simple Moving Average (SMA), the price of TON on the 4-hour chart is currently showing a short-term bullish correction, marked by a series of bullish candlesticks. However, it is important to note that the cryptocurrency may eventually decline toward the $6 support level again, as it remains trading below the 100-day SMA.
Although the signal line of the Relative Strength Index (RSI) indicator on the 4-hour chart is attempting an upward move, it is still trending below the 50% level. This suggests that the current bullish trend may be short-lived, as momentum could shift from bullish to bearish, potentially driving the price towards the $6 support mark.
On the 1-day chart, Toncoin is attempting to retest the 100-day SMA by forming a single bullish candlestick after breaching below it. Following this retest, the cryptocurrency asset may resume its downward movement towards the $6 support mark.
Finally, it can be observed that the signal line of the 1-day RSI indicator has crossed below 50% and is currently moving towards the oversold zone. This positioning of the RSI indicator indicates a potential shift in momentum from bullish to bearish for TON’s price.
Conclusion: Assessing The Long-Term Outlook For ToncoinExploring TON’s long-term outlook reveals that if the coin’s momentum shifts from bullish to bearish, the price will begin to move downward toward the $6 support mark. When the price reaches this level and breaks below, it may move lower to test the $4.6 support mark and probably move on to test other lower support marks on the chart if the price breaches this level.
However, should Toncoin reach the $6 support range and experience a rebound, it could begin to move upward toward the $7.75 resistance mark. If the price breaks through this resistance, it may continue to rise, testing its all-time high of $8.20 and potentially establishing a new all-time high when this mark is surpassed.
Why this matters
This cryptocurrency story adds another data point to the current market tape and is useful when read alongside nearby source coverage.
Original source
Read on NewsBTCRelated market context

Standard Chartered says Ethena’s ENA could crush Bitcoin and Ethereum returns by 2028
Standard Chartered expects Ethena’s ENA token to rise about sevenfold by 2028, provided the protocol can rebuild its shrinking syn...

David Lawant: Bitcoin Entering New “Bullish Regime” According to Options Market
Bitcoin Magazine David Lawant: Bitcoin Entering New “Bullish Regime” According to Options Market Bitcoin futures open interest is...

Perplexity AI Predicts Insane $40 Price Target for XRP: How Did It Get There?
Perplexity AI predicts something that few analysts or other AI models do. It has produced an insanely wild bullish prediction for...
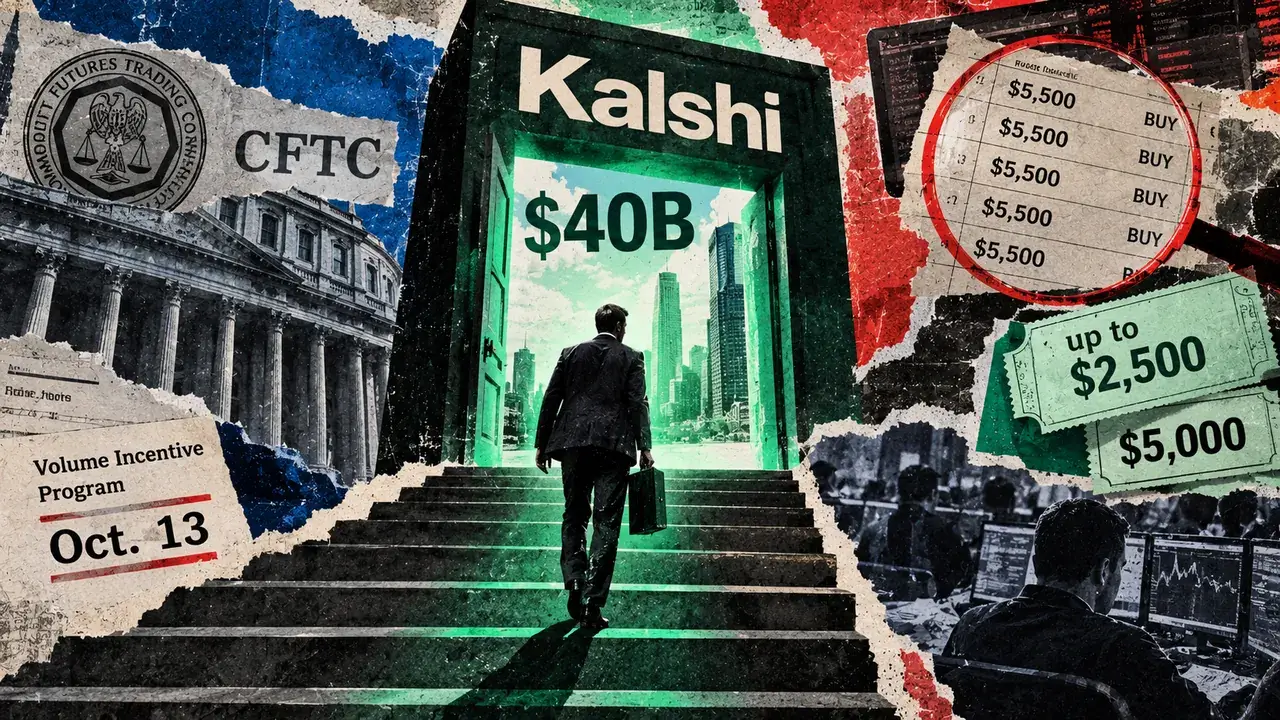
Kalshi’s $40 billion growth story hits tough questions about its trading volume
Kalshi is ending a trader-volume incentive program nearly a year early as scrutiny of activity in its crypto markets intensifies....

UK’s 2027 crypto rules let firms remove trust protection from Bitcoin lent for yield
UK crypto firms can now apply for authorization as of Sept. 30, bringing Bitcoin holders closer to a rulebook that will treat coin...

Sparkling Launches the Trading App That Comes With an Agent
Abu Dhabi, UAE, September 30th, 2026, Chainwire Trade crypto, perpetual futures, prediction markets and tokenized US stocks from o...