Bitcoin, Ethereum Technical Analysis: BTC, ETH Decline as USD Strengthens Following Retail Sales Data
Bitcoin was in the red for a second consecutive session, as markets continued to digest the latest U.S. retail sales figures. Sales rose by more than expected in October, coming in at 1.3%, versus expectations of a 1% in...
Archive context
Older archive item. Useful for background and entity history, but not a fresh market-moving signal.

Bitcoin was in the red for a second consecutive session, as markets continued to digest the latest U.S. retail sales figures. Sales rose by more than expected in October, coming in at 1.3%, versus expectations of a 1% increase. The result fueled market belief that the U.S Federal Reserve will now pivot its policy. Ethereum dropped below $1,200 in today’s session.
Bitcoin
Bitcoin (BTC) fell for a second straight day, as markets continued to react to the latest U.S. retail sales report.
Following the better than expected increase in consumer spending, BTC/USD slipped to a low of $16,430.11 earlier in today’s session.
The drop comes a day after the token was at a high of $16,726.44, but it now seems to be heading for a recent price floor.
Looking at the chart, this support point appears to be at the $16,200 level, which has been the last line of defense prior to the token moving below $16,000 in recent days.
A positive for long-term bulls is that the 10-day (red) moving average looks as though it has somewhat exhausted its downward momentum, with a shift in sentiment potentially in the cards.
Should an upcoming floor of 34.00 on the relative strength index (RSI) hold firm, then we could see BTC bulls begin to buy this current dip.
In addition to bitcoin, ethereum (ETH) also plunged in today’s session, with prices falling below $1,200.
The world’s second largest cryptocurrency has been down by roughly 2% on Thursday, falling to a low of $1,189.21 in the process.
This decline saw ETH/USD break out of its recent floor, with the next visible point of support at the $1,105 mark.
Unlike BTC, it seems as though the moving averages on ETH could still be heading lower, which could prevent many bears from entering at this moment.
Currently, the RSI here is hovering near a floor of 38.00, and should this hold, we could see prices begin to rebound.
However, if a breakout does take place, it is likely we could see ethereum head below $1,100.
Register your email here to get weekly price analysis updates sent to your inbox:
Will the Federal Reserve change its monetary policy in the next meeting? Leave your thoughts in the comments below.
Why this matters
This ethereum story adds another data point to the current market tape and is useful when read alongside nearby source coverage.
Original source
Read on Bitcoin NewsRelated market context

XRP Price at the $1 Line: Should You Sell or Add More to Your Bag?
XRP is dangerously close to losing the $1 price mark, putting holders in an uncomfortable position. Some holders may see another b...

Bitcoin (BTC) Price Today: $65K Support Under Pressure as Glassnode Maps $60K–$62K Liquidation Cluster
Glassnode’s futures liquidation heat map identifies a concentrated cluster of leveraged long positions between $60,000 and $62,000...
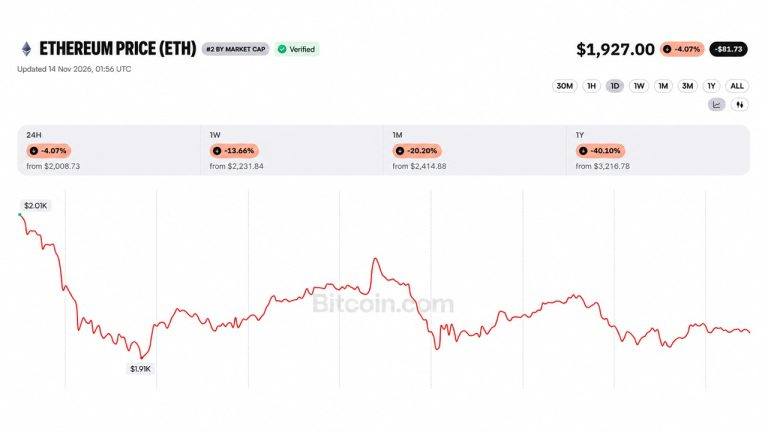
Ether Price Dips Below $2K as Ethereum Foundation Dumps 5000 ETH in 5 Day
A wallet linked to the Ethereum Foundation sold another 1,000 ETH on Saturday, taking its five-day total to 5,000 ETH, or about $9...

XRP Price Today: $0.98 Support Under Threat Despite Oversold RSI
Deeply oversold indicators suggest a possible relief bounce, but the broader technical structure remains bearish. The XRP price ha...

Bitcoin ETFs Shed $2.35 Billion in Two Weeks as BlackRock’s Outflow Streak Hits 11
Bitcoin ETF outflows have reached $2.347 billion across the first two completed November trading weeks, leaving a persistent hole...

Bitcoin drops below $64,000 as bullish bets get wiped out over the weekend
CoinGecko showed BTC near $65,500 on the afternoon of Nov. 14, while Newhedge recorded long-liquidation events below $66,000. Read...