Bitcoin, Ethereum Technical Analysis: BTC Falls Below $24,000 Ahead of US Consumer Sentiment Data
Bitcoin fell back below $24,000 on Feb. 24, as markets anticipated the release of the upcoming consumer sentiment figures from the United States. The report from the University of Michigan is expected to show an increase...
Archive context
Older archive item. Useful for background and entity history, but not a fresh market-moving signal.
Bitcoin fell back below $24,000 on Feb. 24, as markets anticipated the release of the upcoming consumer sentiment figures from the United States. The report from the University of Michigan is expected to show an increase in confidence, despite current inflationary pressures. Ethereum marginally retreated from Thursday’s high.
Bitcoin
Bitcoin (BTC) was once again trading below $24,000 on Friday, as markets began to anticipate the release of U.S. consumer sentiment data.
BTC/USD fell to an intraday low of $23,693.92 earlier in today’s session, less than 24 hours after hitting a peak of $24,177.57.
Today’s move comes as bitcoin was unable to sustain a recent breakout of a long-term ceiling at $24,200.
Looking at the chart, the 14-day relative strength index (RSI) also experienced a breakout, with the index moving below a floor at 58.00
Currently, the index is tracking at a reading of 55.97, with the next visible point of support at the 53.00 zone.
Should bears attempt to reach this level, there is a strong chance that bitcoin will be trading under $23,000.
In addition to BTC, ethereum (ETH) fell from Thursday’s high, with the cryptocurrency also impacted by today’s increased volatility.
Following a high of $1,666.13 during yesterday’s session, ETH/USD slipped to a low of $1,632.57 on Friday.
The drop saw ethereum move further away from its long-term ceiling at $1,675, and closer to a floor at $1,630.
Since hitting this earlier high, prices have gone on to rebound, with ethereum now trading at $1,648.37.
This comes as price strength seems to have found a floor at 54.00, and is currently hovering above this point.
At the time of writing, the index is tracking at 54.35, with the 10-day (red) moving average upward facing, which could be a sign of an upcoming rally.
Register your email here to get weekly price analysis updates sent to your inbox:
Do you expect prices to rebound following today’s report? Leave your thoughts in the comments below.
Why this matters
This ethereum story adds another data point to the current market tape and is useful when read alongside nearby source coverage.
Original source
Read on Bitcoin NewsRelated market context

XRP Price Today: $0.98 Support Under Threat Despite Oversold RSI
Deeply oversold indicators suggest a possible relief bounce, but the broader technical structure remains bearish. The XRP price ha...
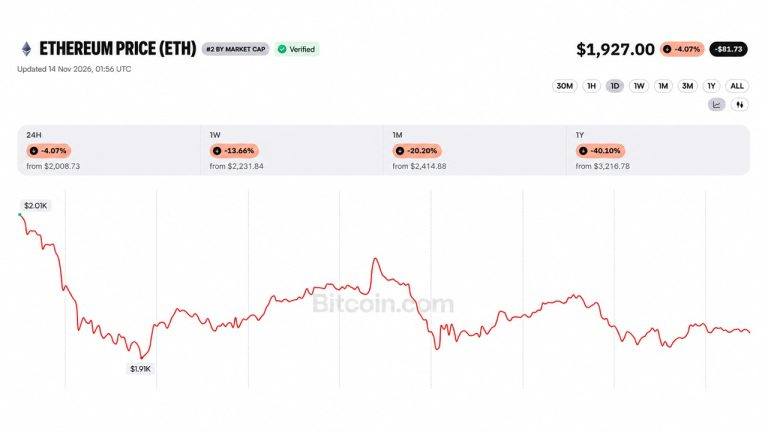
Ether Price Dips Below $2K as Ethereum Foundation Dumps 5000 ETH in 5 Day
A wallet linked to the Ethereum Foundation sold another 1,000 ETH on Saturday, taking its five-day total to 5,000 ETH, or about $9...

XRP Price at the $1 Line: Should You Sell or Add More to Your Bag?
XRP is dangerously close to losing the $1 price mark, putting holders in an uncomfortable position. Some holders may see another b...

Bitcoin (BTC) Price Today: $65K Support Under Pressure as Glassnode Maps $60K–$62K Liquidation Cluster
Glassnode’s futures liquidation heat map identifies a concentrated cluster of leveraged long positions between $60,000 and $62,000...

Crypto Fear & Greed Index sinks to 21 as ETH and XRP hit multi-month lows
Market sentiment's rapid decline highlights potential for capitulation, possibly preceding a relief rally, as liquidity continues...

Bitcoin Price Falls 14% in a Week to $65,000 as Weekend Selling Breaks Friday’s Low
Bitcoin Magazine Bitcoin Price Falls 14% in a Week to $65,000 as Weekend Selling Breaks Friday’s Low Bitcoin price crashed about 1...