Ethereum Bears Keep Pressing, Why ETH Price Might Revisit This Key Support
Ethereum price is moving lower from $2,130. ETH is showing a few bearish signs and might decline toward the $1,920 support zone. Ethereum is slowly moving lower below the $2,060 zone. The price is trading below $2,060 an...

Ethereum price is moving lower from $2,130. ETH is showing a few bearish signs and might decline toward the $1,920 support zone.
- Ethereum is slowly moving lower below the $2,060 zone.
- The price is trading below $2,060 and the 100-hourly Simple Moving Average.
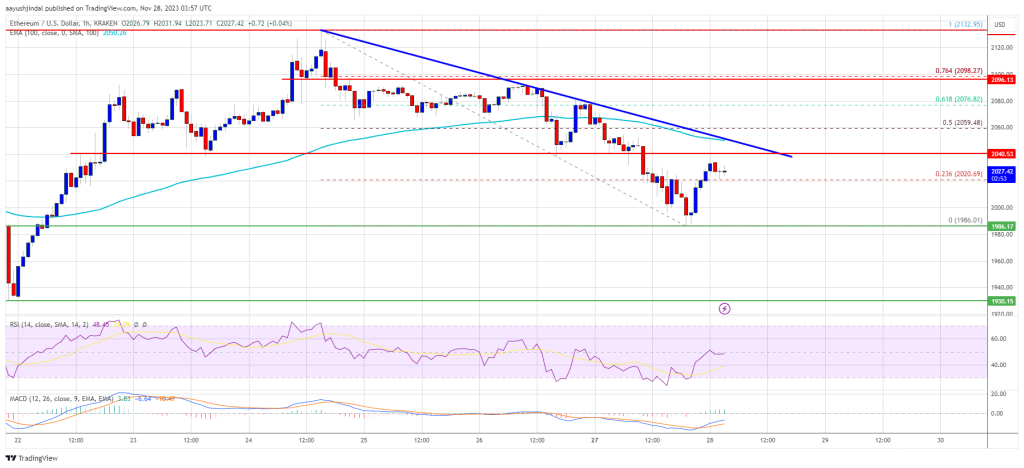
- There is a major bearish trend line forming with resistance near $2,040 on the hourly chart of ETH/USD (data feed via Kraken).
- The pair could continue to move down toward the $1,920 support zone.
Ethereum price started a fresh decline after it struggled near $2,130. ETH formed a high at $2,132 and started a downward movement. There was a move below the $2,100 and $2,080 levels, like Bitcoin.
The price even spiked below the $2,000 support. A low was formed near $1,986 and the price is now consolidating losses. There was a minor recovery wave above the $2,020 level. Ether climbed above the 23.6% Fib retracement level of the recent drop from the $2,132 swing high to the $1,986 low.
Ethereum is now trading below $2,060 and the 100-hourly Simple Moving Average. On the upside, the price is facing resistance near the $2,040 zone. There is also a major bearish trend line forming with resistance near $2,040 on the hourly chart of ETH/USD.
The first key resistance is near the $2,060 level or the 50% Fib retracement level of the recent drop from the $2,132 swing high to the $1,986 low. The next resistance sits at $2,100. A clear move above the $2,100 level could send the price toward the $2,135 resistance zone.
Source: ETHUSD on TradingView.com
The next resistance is near $2,150, above which the price could aim for a move toward the $2,200 level. Any more gains could start a wave toward the $2,250 level.
More Losses in ETH?If Ethereum fails to clear the $2,040 resistance, it could start a fresh decline. Initial support on the downside is near the $2,000 level.
The next key support is $1,985. A downside break below $1,985 might send Ether toward the $1,920 support. The key support is now at $1,885, below which there is a risk of a move toward the $1,820 level.
Technical Indicators
Hourly MACD – The MACD for ETH/USD is losing momentum in the bullish zone.
Hourly RSI – The RSI for ETH/USD is now below the 50 level.
Major Support Level – $1,985
Major Resistance Level – $2,040
Original source
Read on NewsBTCRelated market context

Wall Street is moving past crypto pilots and deeper into Ethereum, says Etherealize founder
In an interview with CoinDesk, Etherealize cofounder Vivek Raman said Ethereum is currently in a transitional phase where the infr...

Fireblocks Says Institutional ETH Staking Is Moving Toward Standardized Rails
TL;DR Fireblocks says it has launched ETH Staking Link, a standardized interface for institutional Ethereum staking integrations....

Standard Chartered Says Bitcoin Bottomed Near $59,000 As Crypto Winter Ends
TL;DR Standard Chartered’s Geoffrey Kendrick reportedly says Bitcoin’s $59,000 area marked the cycle bottom. The note cites SpaceX...

Michael Saylor says investor confidence in Ethereum has collapsed
Ethereum's declining investor confidence signals a shift towards Bitcoin dominance, emphasizing real-world utility over speculativ...

Google Gemini AI Predicts Jaw-Dropping XRP Price For Next 90 Days
Google Gemini AI just put XRP back under the spotlight, predicting it is tightly wound for a major breakout toward $1.60 to $1.80...

Bitcoin price challenges $64,000 weekend wall – needing a breakout or risk a deeper correction
Bitcoin reclaimed $64,000 on June 12 and touched an intraday high of $64,301 in the same session that spot ETF flows finally flipp...