Ethereum Flashes Once-In-A Decade Bull Signal, Says Analyst
Ethereum’s chart is lighting up with what crypto analyst Kevin of Kev Capital calls a “once-in-a-decade” confluence of bullish signals — patterns and indicators that he says have not appeared together in the asset’s hist...
Archive context
Older archive item. Useful for background and entity history, but not a fresh market-moving signal.

Ethereum’s chart is lighting up with what crypto analyst Kevin of Kev Capital calls a “once-in-a-decade” confluence of bullish signals — patterns and indicators that he says have not appeared together in the asset’s history. In a video update on August 12, Kevin revisited his May forecast for “ETH season” and detailed why the rally is unfolding almost exactly as projected, while warning that the final technical barrier is still intact.
Ethereum Faces On Last HurdleTwo months ago, when sentiment toward Ethereum was at its most pessimistic in years, Kevin issued an alert based on the ETH/USD, ETH dominance, and ETH/BTC monthly charts. “We were probably the first people flashing these warning signals on ETH… it was so blatant and so obvious… something historical,” he said. Since that call, ETH has gained more than 150%, with related “beta plays” such as Chainlink, Uniswap, and Ethereum Classic seeing triple-digit percentage gains from their lows.
The catalyst, Kevin explained, began with a rare monthly demand candle at major support — a formation that in past cycles preceded massive rallies. That was backed by multiple momentum indicators turning from extreme oversold levels.
The monthly Stock RSI showed what he described as an unprecedented “V-shaped turnaround,” the MACD histogram had been coiling tighter since late 2019, and whale money flow was reversing from the lowest readings in Ethereum’s history. “You’re now just seeing the monthly MACD cross at the apex of this pattern… right at the zero line,” he noted, framing it as the technical ignition point for a sustained breakout.
On ETH dominance, Kevin pointed to the same multi-indicator alignment: oversold RSI and Stock RSI, an imminent MACD cross, and price hitting the same support that underpinned the 2019–2020 cycle. In his view, that bottom signaled the start of a durable phase of ETH outperformance, one that would lead altcoins higher. The ETH/BTC chart, he argued, confirmed the timing: “The lead altcoin showed the way… the bottom is obviously in.”
Still, Kevin stressed that Ethereum is not yet in open price discovery. The key resistance remains its previous all-time high at roughly $4,850. “We’re not in the clear… don’t be buying into four-year major historical resistance levels. That’s never smart. That will get you hurt,” he warned, noting that on the broader “Total 2” market cap chart for all altcoins excluding Bitcoin, the $1.71–$1.72 trillion zone is the last major “line in the sand.” Until those levels are broken on high time frames, he sees the market in a high-risk, high-reward posture.
Macro conditions may tip the scales. With CME FedWatch now pricing in a 90%+ probability of a US interest rate cut in September, and additional cuts projected for October and December, Kevin believes the mix of easing monetary policy and technical breakout structures creates a “perfect recipe” for altcoin outperformance. Even so, he cautioned that macro shocks could derail momentum and that traders should position with pullbacks in mind rather than chasing into resistance.
For now, Kevin is content to acknowledge a rare technical alignment that he believes has already made history. “The ETH dominance call, the ETH versus Bitcoin call that we made a few months ago has played out beautifully… I think there will be pullbacks, but overall, we are on the back half of this bull market,” he said. Whether that back half erupts into price discovery hinges on one number: $4,850. Until then, Ethereum’s once-in-a-decade bull signal remains charged — but not yet fully unleashed.
At press time, ETH traded at $4,624.
Why this matters
This ethereum story adds another data point to the current market tape and is useful when read alongside nearby source coverage.
Original source
Read on NewsBTCRelated market context

Contrarian Crypto Analyst Who Predicted 2026 Perfectly Calls for Caution and Q4 Crash
Bitcoin pushing back toward $86,000 has many retail traders convinced the bear market is dead and the bulls are back in full contr...

ETH USD Loses Ground as Ethereum Price Analysis Remains Targeting $3,000 This Week
Ethereum Price Prediction, September 23: Ethereum (ETH) trades at $2,735, down a marginal 0.61% over the past 24 hours, a pause, n...
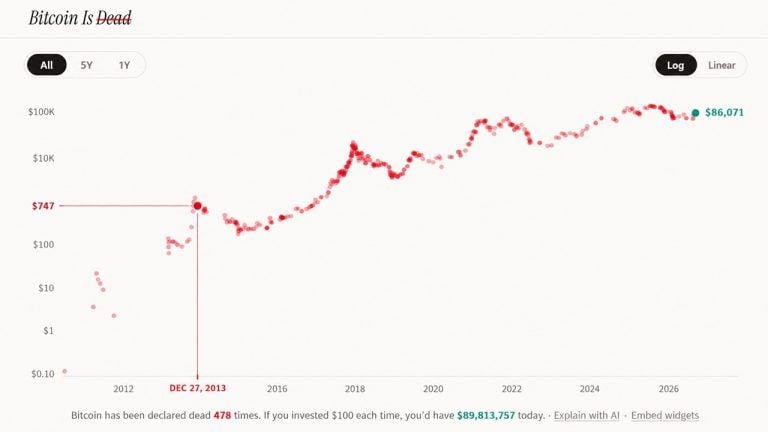
What $1,000 Would Be Worth at Every Major ‘Bitcoin Is Dead’ Call
A quick look at the numbers shows bitcoin has been declared dead 478 times since 2010. Here are some dollar figures on what ignori...

Bitcoin’s Bull Run Is Back — and the Data Agrees
Bitcoin Magazine Bitcoin’s Bull Run Is Back — and the Data Agrees Bitcoin’s run this weekend would have observers believing that t...

XRP Price Today: XRP Hits $1.60 as Heavy Whale Accumulation Points to a $2 Rally and Beyond
The XRP price reached $1.6060 on September 23 after opening near $1.5808, according to historical market data. The token subsequen...

Can Ripple Crack $1.80? XRP Price Prediction Says This Week
XRP Price Prediction: Ripple (XRP) trades at $1.59 as of this writing, up 1.6% on the day, with a 24-hour range spanning $1.5577 t...