Ethereum Price Bears Keep Pushing, Why Decline Isn’t Over Yet
Ethereum price is moving lower below the $2,250 support zone. ETH is now at risk of more downsides below the $2,120 support zone. Ethereum struggled to start a fresh increase above the $2,250 resistance. The price is tra...

Ethereum price is moving lower below the $2,250 support zone. ETH is now at risk of more downsides below the $2,120 support zone.
- Ethereum struggled to start a fresh increase above the $2,250 resistance.
- The price is trading below $2,250 and the 100-hourly Simple Moving Average.
- There is a key declining channel forming with resistance near $2,225 on the hourly chart of ETH/USD (data feed via Kraken).
- The pair could continue to move down if it declines below the $2,120 support zone.
Ethereum price attempted a fresh increase above the $2,120 and $2,150 levels. ETH even climbed above the $2,200 level, but the bears were active near the $2,250 level. A high was formed near $2,252 and the price started a fresh decline, like Bitcoin.
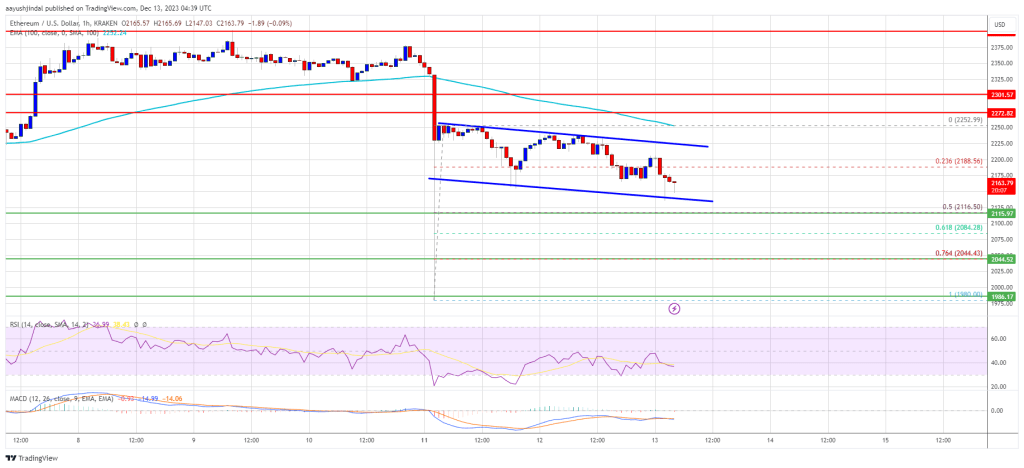
There was a move below the $2,200 support zone. The price declined below the 23.6% Fib retracement level of the upward move from the $1,980 swing low to the $2,252 high.
Ethereum is now trading below $2,250 and the 100-hourly Simple Moving Average. There is also a key declining channel forming with resistance near $2,225 on the hourly chart of ETH/USD. If there is a fresh increase, the pair might face resistance near the $2,200 level.
Source: ETHUSD on TradingView.com
The next key resistance is near the $2,225 level or the channel trend line. The main resistance is still near $2,250. A clear move above the $2,250 zone could send the price toward the $2,300 level. The next resistance sits at $2,350. Any more gains could start a wave toward the $2,500 level.
More Losses in ETH?If Ethereum fails to clear the $2,225 resistance, it could continue to move down. Initial support on the downside is near the $2,120 level or the 50% Fib retracement level of the upward move from the $1,980 swing low to the $2,252 high.
The next key support is $2,045. The main support is now near $2,000. A downside break below $2,000 might start another major decline. In the stated case, Ether could revisit the $1,880 support. Any more losses might call for a test of the $1,820 support zone in the near term.
Technical Indicators
Hourly MACD – The MACD for ETH/USD is gaining momentum in the bearish zone.
Hourly RSI – The RSI for ETH/USD is now below the 50 level.
Major Support Level – $2,120
Major Resistance Level – $2,225
Original source
Read on NewsBTCRelated market context

Standard Chartered Says Bitcoin Bottomed Near $59,000 As Crypto Winter Ends
TL;DR Standard Chartered’s Geoffrey Kendrick reportedly says Bitcoin’s $59,000 area marked the cycle bottom. The note cites SpaceX...

Elon Musk SpaceX AI Predicts Incredible Bitcoin Price For Next 30 Days
Here is the thing about capitulation calls. They only sound smart in hindsight. Right now, with Bitcoin price scraping along the l...

XRP aims for $0.90 as ETF demand battles selling pressure from whales
XRP is trading at $1.11, down roughly 17% from its June opening, having set a new 2026 low on June 5 and shed $8 billion in market...

XRP Price Prediction: Japan XRP ETF Listing is Getting Closer
Japan just handed XRP bulls a major regulatory tailwind. XRP price is retesting a congestion zone, and the prediction could turn b...

Michael Saylor says investor confidence in Ethereum has collapsed
Ethereum's declining investor confidence signals a shift towards Bitcoin dominance, emphasizing real-world utility over speculativ...

Blackrock’s IBIT Leads $86 Million Bitcoin ETF Inflow as Ethereum Funds Extend Outflow Streak
Spot bitcoin exchange-traded funds (ETFs) drew $85.85 million in net inflows on Friday, with every one of the 12 tracked funds avo...