Ethereum Price Consolidates Below Hurdle, What Could Trigger Fresh Increase
Ethereum price started a consolidation phase after a sharp decline. ETH must clear the $2,275 resistance to start a fresh increase in the near term. Ethereum recovered losses after testing the $2,000 support zone. The pr...

Ethereum price started a consolidation phase after a sharp decline. ETH must clear the $2,275 resistance to start a fresh increase in the near term.
- Ethereum recovered losses after testing the $2,000 support zone.
- The price is trading below $2,320 and the 100-hourly Simple Moving Average.
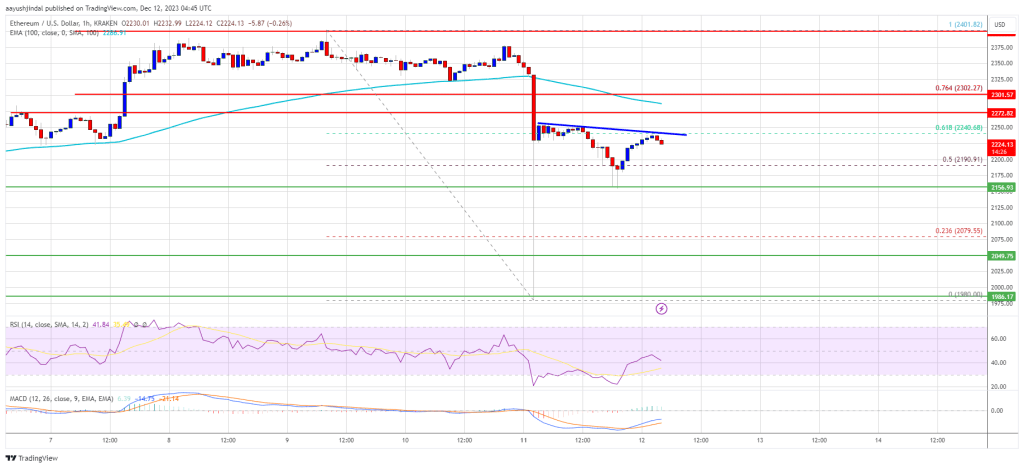
- There is a key bearish trend line forming with resistance near $2,240 on the hourly chart of ETH/USD (data feed via Kraken).
- The pair could gain bullish momentum if it clears the $2,250 and $2,275 resistance levels.
Ethereum price started a sharp decline below the $2,300 pivot level, like Bitcoin. ETH declined heavily below the $2,220 and $2,200 levels. Finally, it tested the $2,000 support before the bulls emerged.
A low was formed near $1,980 and the price is now attempting a recovery wave. There was a move above the $2,120 and $2,150 resistance levels. The bulls pushed the price above the 50% Fib retracement level of the downward wave from the $2,400 swing high to the $1,980 low.
Ethereum is now trading below $2,320 and the 100-hourly Simple Moving Average. On the upside, the price is facing resistance near the $2,250 zone. There is also a key bearish trend line forming with resistance near $2,240 on the hourly chart of ETH/USD.
Source: ETHUSD on TradingView.com
The next key resistance is near the $2,275 level or the 76.4% Fib retracement level of the downward wave from the $2,400 swing high to the $1,980 low. A clear move above the $2,300 zone could send the price toward the $2,400 level. The next resistance sits at $2,450. Any more gains could start a wave toward the $2,500 level.
More Losses in ETH?If Ethereum fails to clear the $2,275 resistance, it could start another decline. Initial support on the downside is near the $2,155 level.
The next key support is $2,120. The main support is now near $2,100. A downside break below $2,100 might start another major decline. In the stated case, Ether could revisit the $2,000 support. Any more losses might call for a test of the $1,880 support zone in the near term.
Technical Indicators
Hourly MACD – The MACD for ETH/USD is losing momentum in the bearish zone.
Hourly RSI – The RSI for ETH/USD is now below the 30 level.
Major Support Level – $2,155
Major Resistance Level – $2,275
Original source
Read on NewsBTCRelated market context

Ethereum Price Prediction: 3 Million ETH Rushes Into Staking as Sellers Vanish
Is nobody leaving Ethereum? A record 36 million ETH is now locked in staking, roughly 29–30% of the circulating supply, and the va...

Bitcoin price challenges $64,000 weekend wall – needing a breakout or risk a deeper correction
Bitcoin reclaimed $64,000 on June 12 and touched an intraday high of $64,301 in the same session that spot ETF flows finally flipp...

Elon Musk SpaceX AI Predicts Incredible Bitcoin Price For Next 30 Days
Here is the thing about capitulation calls. They only sound smart in hindsight. Right now, with Bitcoin price scraping along the l...

Standard Chartered Says Bitcoin Bottomed Near $59,000 As Crypto Winter Ends
TL;DR Standard Chartered’s Geoffrey Kendrick reportedly says Bitcoin’s $59,000 area marked the cycle bottom. The note cites SpaceX...

US forces shoot down Iranian attack drones near Strait of Hormuz, Bitcoin drops below $73K
Geopolitical tensions near vital oil routes can destabilize financial markets, highlighting the interconnectedness of global secur...

Are 24/7 CME Bitcoin futures a volatility cure — or a new leverage trap?
Wall Street got to trade Bitcoin around the clock just in time to watch the market fall apart. CME Group launched 24/7 trading for...