Ethereum Price Corrects But This Level Could Trigger Fresh Increase
Ethereum started a downside correction from $1,600 against the US Dollar. ETH could start a fresh increase if it stays above the $1,450 support. Ethereum is correcting gains from the $1,580 and $1,600 resistance levels....

Ethereum started a downside correction from $1,600 against the US Dollar. ETH could start a fresh increase if it stays above the $1,450 support.
- Ethereum is correcting gains from the $1,580 and $1,600 resistance levels.
- The price is now trading above $1,450 and the 100 hourly simple moving average.
- There is a major bearish trend line forming with resistance near $1,540 on the hourly chart of ETH/USD (data feed via Kraken).
- The pair could start a fresh increase if it stays above the $1,450 support zone.
Ethereum started a decent increase above the $1,450 and $1,500 resistance levels. ETH even cleared the $1,550 level and settled above the 100 hourly simple moving average.
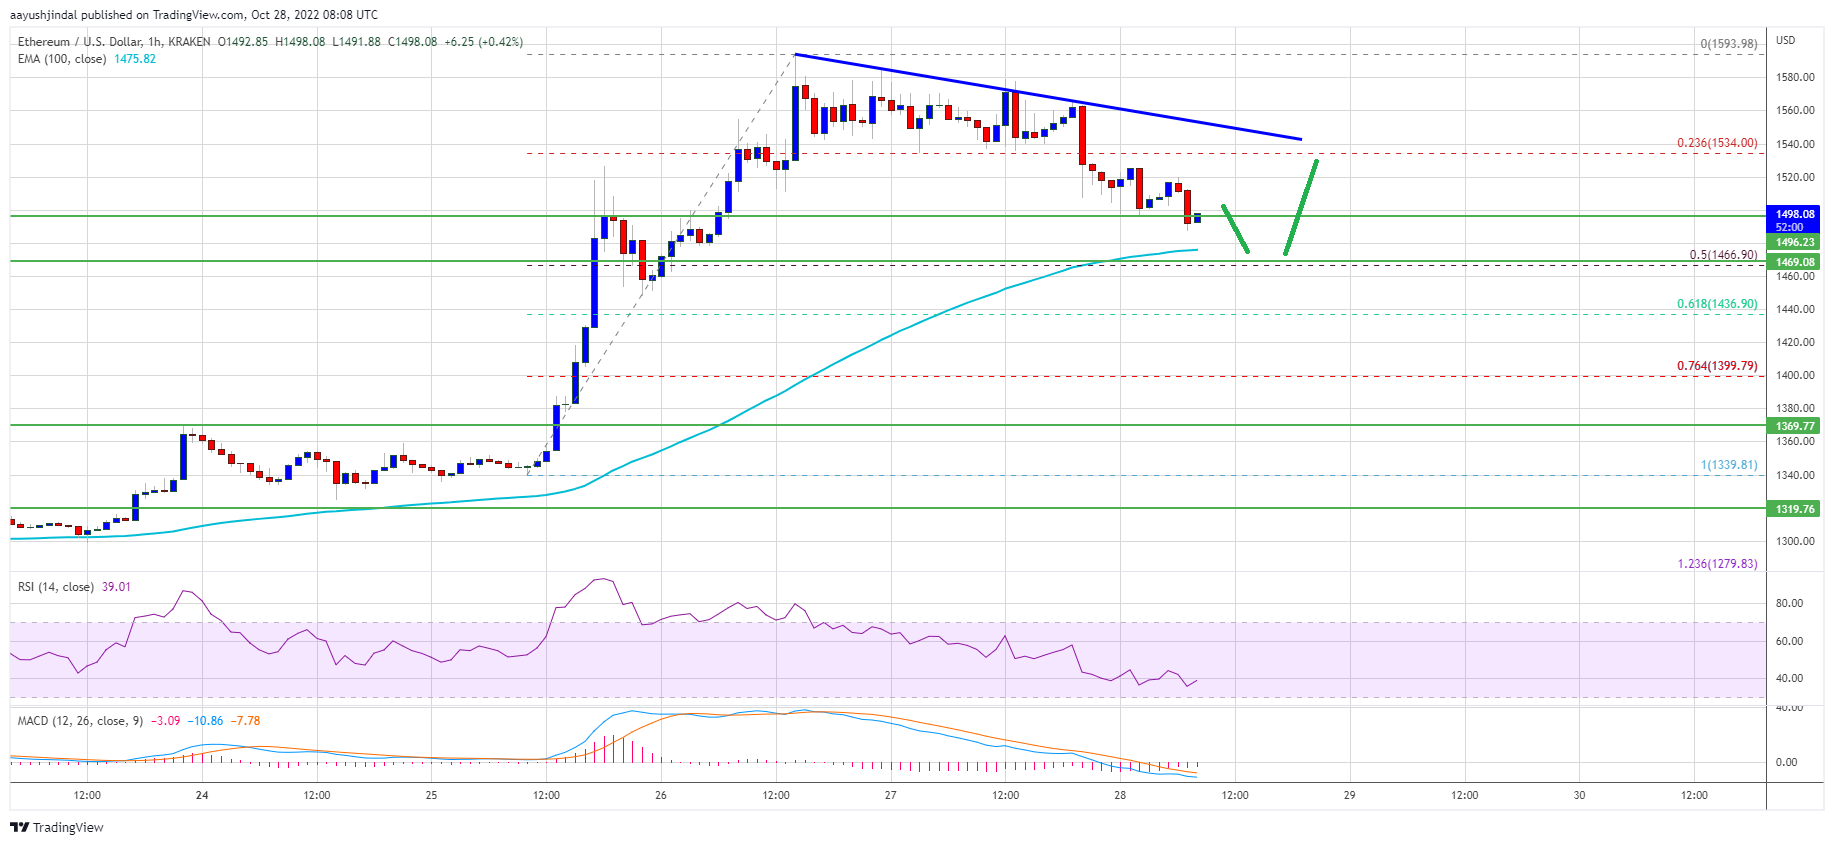
The price traded close to the $1,600 resistance zone. A high was formed near $1,593 before there was a downside correction. There was a drop below the $1,550 level. Ether price even declined below the 23.6% Fib retracement level of the upward wave from the $1,340 swing low to $1,593 high.
It is now trading above $1,450 and the 100 hourly simple moving average. There is also a major bearish trend line forming with resistance near $1,540 on the hourly chart of ETH/USD.
An immediate resistance on the upside is near the $1,540 level and the trend line zone. The first major resistance is near the $1,550 and $1,560 levels, above which the price could gain bullish momentum. The main barrier is now near the $1,600 zone.
Source: ETHUSD on TradingView.com
A clear upside break above the $1,600 resistance zone could set the pace for a fresh rally. In the stated case, the price might rise towards the $1,720 level.
Dips Supported in ETH?If ethereum fails to climb above the $1,550 resistance, it could continue to move down. An initial support on the downside is near the $1,465 level and the 100 hourly simple moving average.
The 50% Fib retracement level of the upward wave from the $1,340 swing low to $1,593 high is also near $1,450. A downside break below the $1,450 zone might increase selling pressure and the price might drop to $1,400 in the near term.
Technical Indicators
Hourly MACD – The MACD for ETH/USD is now gaining momentum in the bearish zone.
Hourly RSI – The RSI for ETH/USD is now below the 50 level.
Major Support Level – $1,450
Major Resistance Level – $1,550
Original source
Read on NewsBTCRelated market context

Standard Chartered Says Bitcoin Bottomed Near $59,000 As Crypto Winter Ends
TL;DR Standard Chartered’s Geoffrey Kendrick reportedly says Bitcoin’s $59,000 area marked the cycle bottom. The note cites SpaceX...

Bitcoin price challenges $64,000 weekend wall – needing a breakout or risk a deeper correction
Bitcoin reclaimed $64,000 on June 12 and touched an intraday high of $64,301 in the same session that spot ETF flows finally flipp...

Elon Musk SpaceX AI Predicts Incredible Bitcoin Price For Next 30 Days
Here is the thing about capitulation calls. They only sound smart in hindsight. Right now, with Bitcoin price scraping along the l...

Bitcoin Mining Cost Model Points To $47,000 Floor, But Analysts Urge Caution
TL;DR Crypto Rover says Bitcoin has never bottomed below electrical production cost, currently estimated at $47,000. Mining-cost m...

Bitcoin rises above $64,000 after Pakistan prime minister says Iran peace deal is near
Bitcoin traded above $64,000 on Saturday, supported by its strongest ETF inflows in a month and growing optimism around geopolitic...

XRP Price Prediction: Japan XRP ETF Listing is Getting Closer
Japan just handed XRP bulls a major regulatory tailwind. XRP price is retesting a congestion zone, and the prediction could turn b...