Ethereum Price Defies Gravity, Here’s What Could Spark Bullish Moves
Ethereum price managed to stay above the $1,520 support against the US dollar. ETH is rising and might rally if it clears the $1,605 resistance. Ethereum averted more losses below the $1,520 support zone. The price is tr...

Ethereum price managed to stay above the $1,520 support against the US dollar. ETH is rising and might rally if it clears the $1,605 resistance.
- Ethereum averted more losses below the $1,520 support zone.
- The price is trading above $1,560 and the 100-hourly Simple Moving Average.
- There was a break above a major bearish trend line with resistance near $1,562 on the hourly chart of ETH/USD (data feed via Kraken).
- The pair is moving higher toward the breakout zone at $1,605.
Ethereum managed to stay above the main breakdown support at $1,520. The recent rise in XRP is sparking a recovery wave in the crypto market. ETH managed to start an increase above the $1,550 and $1,565 resistance levels, like Bitcoin.
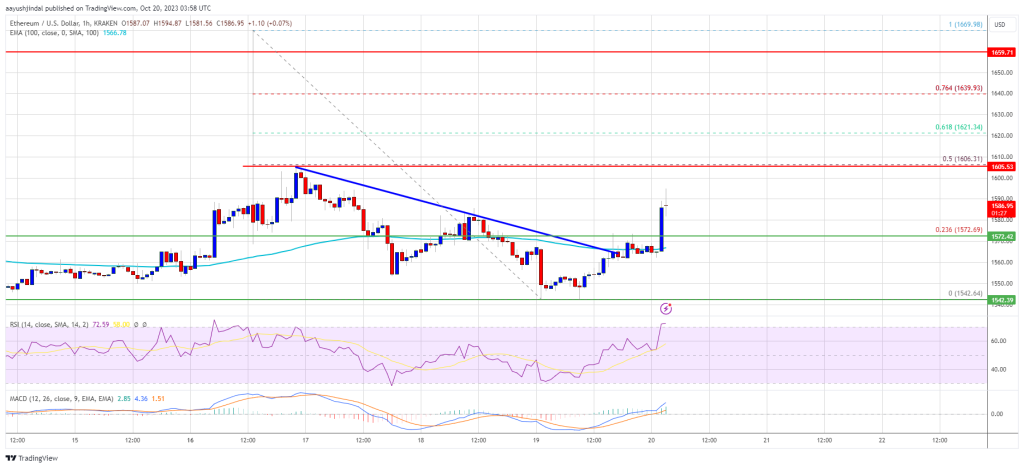
There was a break above a major bearish trend line with resistance near $1,562 on the hourly chart of ETH/USD. The pair climbed above the 23.6% Fib retracement level of the downward move from the $1,669 swing high to the $1,542 low.
Ethereum is now trading above $1,565 and the 100-hourly Simple Moving Average. On the upside, the price is facing resistance near the $1,600 level.
The first major resistance is near the $1,605 zone or the 50% Fib retracement level of the downward move from the $1,669 swing high to the $1,542 low. The next key resistance is $1,620. A close above the $1,605 and $1,620 resistance levels might start a steady increase.
Source: ETHUSD on TradingView.com
In the stated case, Ether could start a recovery wave toward the $1,665 resistance. Any more gains might open the doors for a move toward $1,750.
Another Decline in ETH?If Ethereum fails to clear the $1,605 resistance, it could start another decline. Initial support on the downside is near the $1,575 level and the 100-hourly Simple Moving Average.
The next key support is $1,540. The main support is still near $1,520. A downside break below the $1,520 support might send the price further lower. In the stated case, the price could drop toward the $1,440 level. Any more losses may perhaps send Ether toward the $1,350 level in the medium term.
Technical Indicators
Hourly MACD – The MACD for ETH/USD is gaining momentum in the bullish zone.
Hourly RSI – The RSI for ETH/USD is now above the 50 level.
Major Support Level – $1,575
Major Resistance Level – $1,605
Original source
Read on NewsBTCRelated market context

Fireblocks Says Institutional ETH Staking Is Moving Toward Standardized Rails
TL;DR Fireblocks says it has launched ETH Staking Link, a standardized interface for institutional Ethereum staking integrations....

Standard Chartered Says Bitcoin Bottomed Near $59,000 As Crypto Winter Ends
TL;DR Standard Chartered’s Geoffrey Kendrick reportedly says Bitcoin’s $59,000 area marked the cycle bottom. The note cites SpaceX...

Elon Musk SpaceX AI Predicts Incredible Bitcoin Price For Next 30 Days
Here is the thing about capitulation calls. They only sound smart in hindsight. Right now, with Bitcoin price scraping along the l...

Bitcoin rises above $64,000 after Pakistan prime minister says Iran peace deal is near
Bitcoin traded above $64,000 on Saturday, supported by its strongest ETF inflows in a month and growing optimism around geopolitic...

Bitcoin Mining Cost Model Points To $47,000 Floor, But Analysts Urge Caution
TL;DR Crypto Rover says Bitcoin has never bottomed below electrical production cost, currently estimated at $47,000. Mining-cost m...

Wall Street is moving past crypto pilots and deeper into Ethereum, says Etherealize founder
In an interview with CoinDesk, Etherealize cofounder Vivek Raman said Ethereum is currently in a transitional phase where the infr...