Ethereum Price Dives: Is Bearish Control on the Horizon?
Ethereum price declined heavily and traded below $2,550. ETH could start another increase if it stays above the $2,400 support zone. Ethereum started a major decline below the $2,650 and $2,550 levels. The price is tradi...

Ethereum price declined heavily and traded below $2,550. ETH could start another increase if it stays above the $2,400 support zone.
- Ethereum started a major decline below the $2,650 and $2,550 levels.
- The price is trading below $2,550 and the 100-hourly Simple Moving Average.
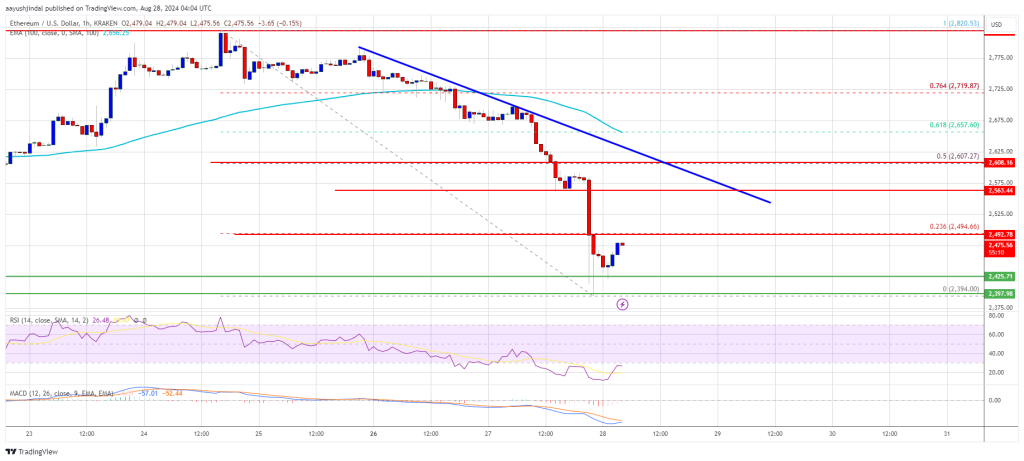
- There is a key bearish trend line forming with resistance at $2,575 on the hourly chart of ETH/USD (data feed via Kraken).
- The pair could start a recovery wave if it stays above the $2,400 level.
Ethereum price failed to recover and extended its decline below the $2,650 level. ETH traded below the $2,550 and $2,500 support levels like Bitcoin. It even spiked below the $2,400 level.
A low was formed at $2,394 and the price is now consolidating losses. There was a minor recovery wave above the $2,420 and $2,440 levels. It traded close to the 23.6% Fib retracement level of the downward move from the $2,820 swing high to the $2,394 low.
Ethereum price is now trading below $2,550 and the 100-hourly Simple Moving Average. If there is a recovery wave, the price could face resistance near the $2,500 level.
The first major resistance is near the $2,550 level. There is also a key bearish trend line forming with resistance at $2,575 on the hourly chart of ETH/USD. A close above the $2,550 level might send Ether toward the $2,600 resistance or the 50% Fib retracement level of the downward move from the $2,820 swing high to the $2,394 low.
The next key resistance is near $2,660. An upside break above the $2,660 resistance might send the price higher toward the $2,880 resistance zone in the near term.
More Downsides In ETH?If Ethereum fails to clear the $2,500 resistance, it could continue to move down. Initial support on the downside is near $2,420. The first major support sits near the $2,400 zone.
A clear move below the $2,400 support might push the price toward $2,350 where the bulls could emerge. Any more losses might send the price toward the $2,220 support level in the near term. The next key support sits at $2,150.
Technical Indicators
Hourly MACD – The MACD for ETH/USD is gaining momentum in the bearish zone.
Hourly RSI – The RSI for ETH/USD is now below the 50 zone.
Major Support Level – $2,400
Major Resistance Level – $2,550
Original source
Read on NewsBTCRelated market context

Standard Chartered Says Bitcoin Bottomed Near $59,000 As Crypto Winter Ends
TL;DR Standard Chartered’s Geoffrey Kendrick reportedly says Bitcoin’s $59,000 area marked the cycle bottom. The note cites SpaceX...

XRP Price Prediction: Japan XRP ETF Listing is Getting Closer
Japan just handed XRP bulls a major regulatory tailwind. XRP price is retesting a congestion zone, and the prediction could turn b...

Michael Saylor says investor confidence in Ethereum has collapsed
Ethereum's declining investor confidence signals a shift towards Bitcoin dominance, emphasizing real-world utility over speculativ...

Bitcoin Mining Cost Model Points To $47,000 Floor, But Analysts Urge Caution
TL;DR Crypto Rover says Bitcoin has never bottomed below electrical production cost, currently estimated at $47,000. Mining-cost m...

Blackrock’s IBIT Leads $86 Million Bitcoin ETF Inflow as Ethereum Funds Extend Outflow Streak
Spot bitcoin exchange-traded funds (ETFs) drew $85.85 million in net inflows on Friday, with every one of the 12 tracked funds avo...

Ethereum Foundation’s Kohaku proposes post-quantum account protection for $0.07
Kohaku's opt-in quantum protection could accelerate Ethereum's security evolution, influencing investor confidence and market dyna...