Ethereum Price Downside Eases: Is Momentum Shifting?
Ethereum price dived below the $2,420 and $2,400 support levels. ETH tested $2,300 and is now showing signs of a decent recovery wave. Ethereum is attempting a recovery wave from the $2,300 zone. The price is trading bel...

Ethereum price dived below the $2,420 and $2,400 support levels. ETH tested $2,300 and is now showing signs of a decent recovery wave.
- Ethereum is attempting a recovery wave from the $2,300 zone.
- The price is trading below $2,500 and the 100-hourly Simple Moving Average.
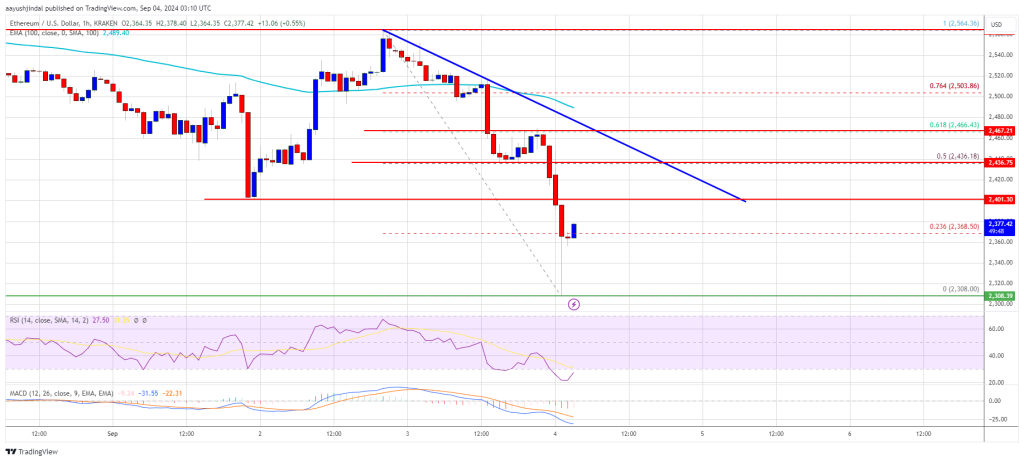
- There is a key bearish trend line forming with resistance at $2,440 on the hourly chart of ETH/USD (data feed via Kraken).
- The pair must clear the $2,500 resistance to start a steady increase in the near term.
Ethereum price extended losses below the $2,420 level. ETH even traded below the $2,400 support before the bulls appeared. A low was formed at $2,308 and the price is now attempting a recovery wave like Bitcoin.
There was a move above the $2,320 and $2,350 resistance levels. The price climbed above the 23.6% Fib retracement level of the downward wave from the $2,564 swing high to the $2,308 low, but there are many hurdles on the upside.
Ethereum price is now trading below $2,500 and the 100-hourly Simple Moving Average. On the upside, the price seems to be facing hurdles near the $2,440 level. It is close to the 50% Fib retracement level of the downward wave from the $2,564 swing high to the $2,308 low.
There is also a key bearish trend line forming with resistance at $2,440 on the hourly chart of ETH/USD. The first major resistance is near the $2,500 level. A close above the $2,500 level might send Ether toward the $2,550 resistance. The next key resistance is near $2,650. An upside break above the $2,650 resistance might send the price higher toward the $2,800 resistance zone in the near term.
Another Decline In ETH?If Ethereum fails to clear the $2,440 resistance, it could start another decline. Initial support on the downside is near $2,320. The first major support sits near the $2,300 zone.
A clear move below the $2,300 support might push the price toward $2,250. Any more losses might send the price toward the $2,120 support level in the near term. The next key support sits at $2,040.
Technical Indicators
Hourly MACD – The MACD for ETH/USD is losing momentum in the bearish zone.
Hourly RSI – The RSI for ETH/USD is now below the 50 zone.
Major Support Level – $2,300
Major Resistance Level – $2,440
Original source
Read on NewsBTCRelated market context

Standard Chartered Says Bitcoin Bottomed Near $59,000 As Crypto Winter Ends
TL;DR Standard Chartered’s Geoffrey Kendrick reportedly says Bitcoin’s $59,000 area marked the cycle bottom. The note cites SpaceX...

Elon Musk SpaceX AI Predicts Incredible Bitcoin Price For Next 30 Days
Here is the thing about capitulation calls. They only sound smart in hindsight. Right now, with Bitcoin price scraping along the l...

Michael Saylor says investor confidence in Ethereum has collapsed
Ethereum's declining investor confidence signals a shift towards Bitcoin dominance, emphasizing real-world utility over speculativ...

Bitcoin Mining Cost Model Points To $47,000 Floor, But Analysts Urge Caution
TL;DR Crypto Rover says Bitcoin has never bottomed below electrical production cost, currently estimated at $47,000. Mining-cost m...

Blackrock’s IBIT Leads $86 Million Bitcoin ETF Inflow as Ethereum Funds Extend Outflow Streak
Spot bitcoin exchange-traded funds (ETFs) drew $85.85 million in net inflows on Friday, with every one of the 12 tracked funds avo...

Ethereum Foundation’s Kohaku proposes post-quantum account protection for $0.07
Kohaku's opt-in quantum protection could accelerate Ethereum's security evolution, influencing investor confidence and market dyna...