Ethereum Price Downtrend May Not Be Over—Sub-$1,700 Levels Loom
Ethereum price started a fresh decline and traded below $1,750. ETH is now consolidating below $1,750 and might continue to move down. Ethereum remained in a bearish zone after a fresh decline below $1,800. The price is...
Archive context
Older archive item. Useful for background and entity history, but not a fresh market-moving signal.

Ethereum price started a fresh decline and traded below $1,750. ETH is now consolidating below $1,750 and might continue to move down.
- Ethereum remained in a bearish zone after a fresh decline below $1,800.
- The price is trading below $1,780 and the 100-hourly Simple Moving Average.
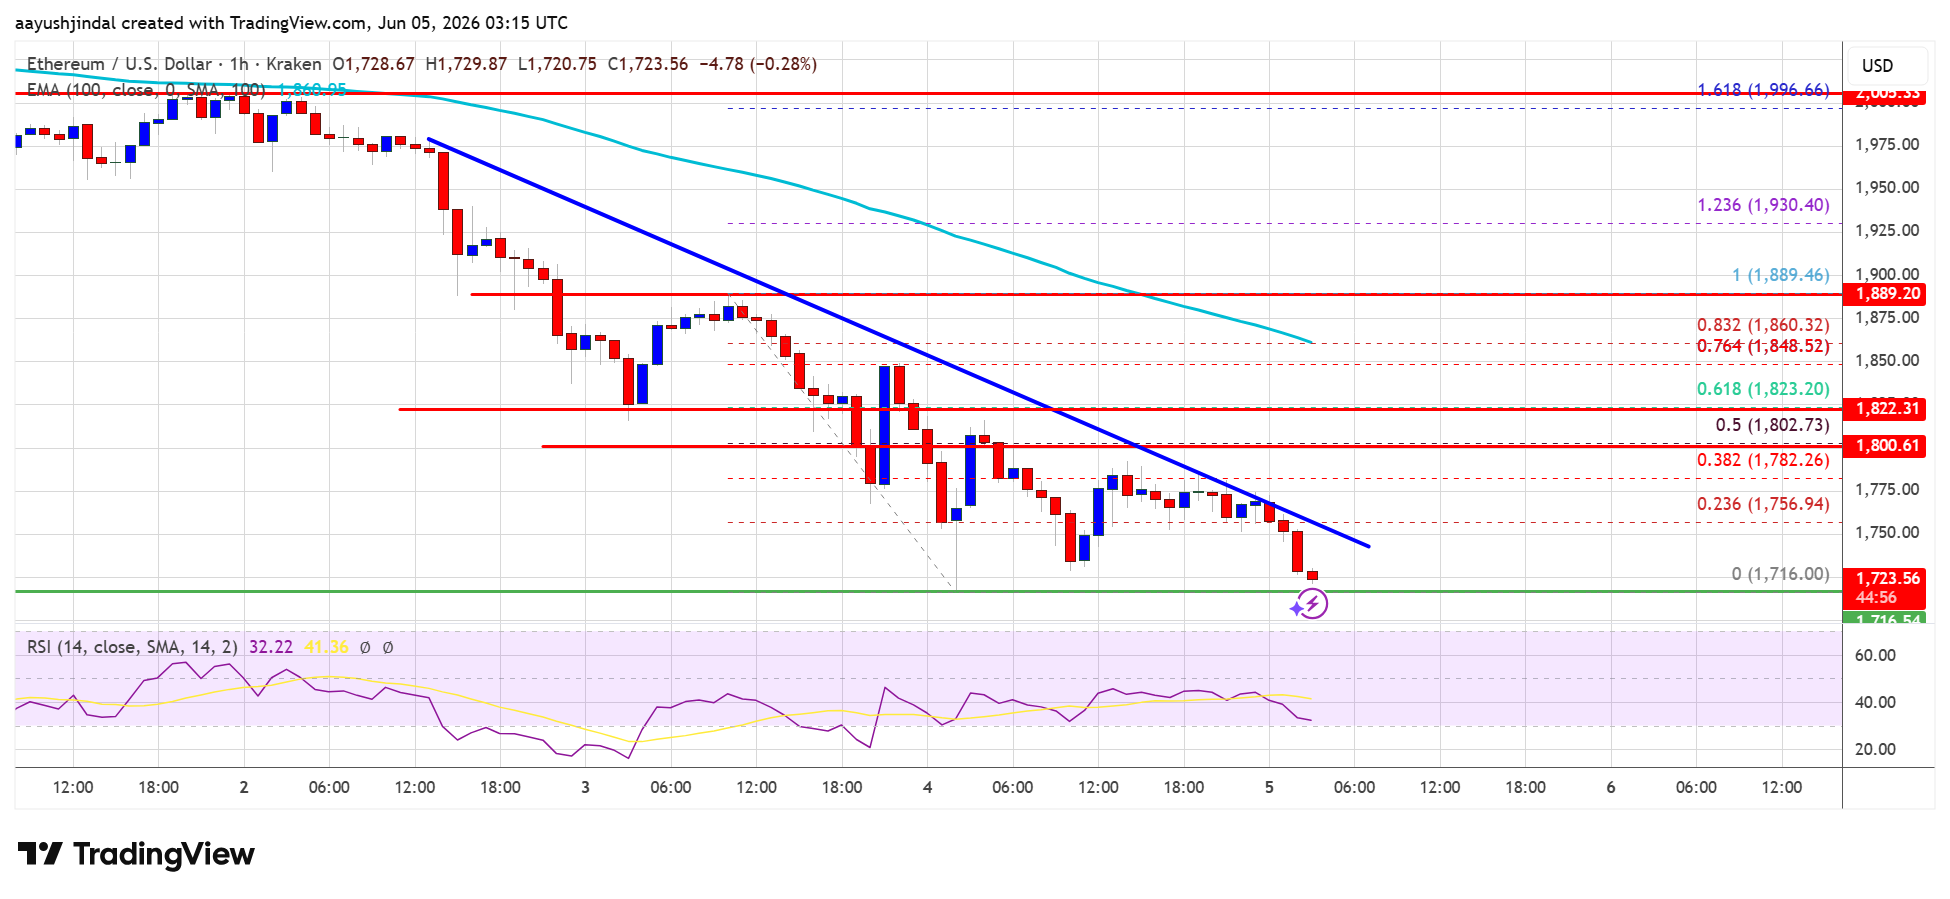
- There is a bearish trend line forming with resistance at $1,750 on the hourly chart of ETH/USD (data feed via Kraken).
- The pair could continue to move down if it stays below the $1,820 zone.
Ethereum price failed to remain stable above $1,840 and started a fresh decline, like Bitcoin. ETH price dipped below the $1,800 and $1,780 levels.
The price even traded below $1,750. A low was formed at $1,715, and the price is now consolidating losses well below the 23.6% Fib retracement level of the downward move from the $1,888 swing high to the $1,715 low. There is also a bearish trend line forming with resistance at $1,750 on the hourly chart of ETH/USD.
Ethereum price is now trading below $1,750 and the 100-hourly Simple Moving Average. If the bulls remain in action above $1,700, the price could attempt another increase. Immediate resistance is seen near the $1,750 level.
The first key resistance is near the $1,800 level and the 50% Fib retracement level of the downward move from the $1,888 swing high to the $1,715 low. The next major resistance is near the $1,820 level. A clear move above the $1,820 resistance might send the price toward the $1,880 resistance. An upside break above the $1,880 region might call for more gains in the coming days. In the stated case, Ether could rise toward the $1,920 resistance zone or even $1,965 in the near term.
Downside Continuation In ETH?If Ethereum fails to clear the $1,880 resistance, it could start a fresh decline. Initial support on the downside is near the $1,715 level. The first major support sits near the $1,680 zone.
A clear move below the $1,680 support might push the price toward the $1,650 support. Any more losses might send the price toward the $1,625 region. The main support could be $1,600.
Technical Indicators
Hourly MACD – The MACD for ETH/USD is gaining momentum in the bearish zone.
Hourly RSI – The RSI for ETH/USD is now below the 50 zone.
Major Support Level – $1,715
Major Resistance Level – $1,880
Why this matters
Ethereum is a tracked market entity in the DigitalMoneyBox archive, making this useful context for readers monitoring repeated mentions and follow-up coverage.
Original source
Read on NewsBTCRelated market context

Ethereum Price Prediction: Unstaking Queue Hits Zero as ETH USD Approaches $2,000
Ethereum validator exit queue has fallen to zero, marking a sharp reversal from a bearish price prediction less than a year ago. E...

South Korea’s Stock Market Triggered 8th Circuit Breaker of 2026: Bitcoin Liquidated 3 Times Near $64,000
Bitcoin News: BTC price is trading at $63,582 on July 28, down 2.12% in the past 24 hours, and the level that keeps breaking trade...

Crypto News, July 28: CLARITY Act Shelved, Bitcoin Drops in Asian Market Rout
In Washington, momentum can vanish as quickly as it arrives. The Clarity Act now sits on the shelf, while the Bitcoin price slips...

Sam Altman ChatGPT AI Predicts Bitcoin Will Do Something Incredible Before 2027
Sam Altman ChatGPT AI is extending the timeline on this one. Rather than an end-of-year prediction, it frames the Bitcoin price pr...

Dogecoin (DOGE) Price Prediction: Can Rare TD Sequential Buy Signals Trigger a Historic Reversal Toward $0.16?
The signals have emerged as Dogecoin trades near $0.073, close to a long-term technical area that has attracted attention from mar...

Bitmine nears 5% Ethereum supply control with $12B treasury
Bitmine's growing Ethereum control may heighten concerns over market centralization, potentially affecting price stability and reg...