Ethereum Price Extends Decline As $2,220 Support Comes Into Play
Ethereum price started a downside correction below $2,350. ETH is now showing a few bearish signs and might decline further if it trades below $2,265. Ethereum started a downside correction below the $2,365 zone. The pri...

Ethereum price started a downside correction below $2,350. ETH is now showing a few bearish signs and might decline further if it trades below $2,265.
- Ethereum started a downside correction below the $2,365 zone.
- The price is trading below $2,320 and the 100-hourly Simple Moving Average.
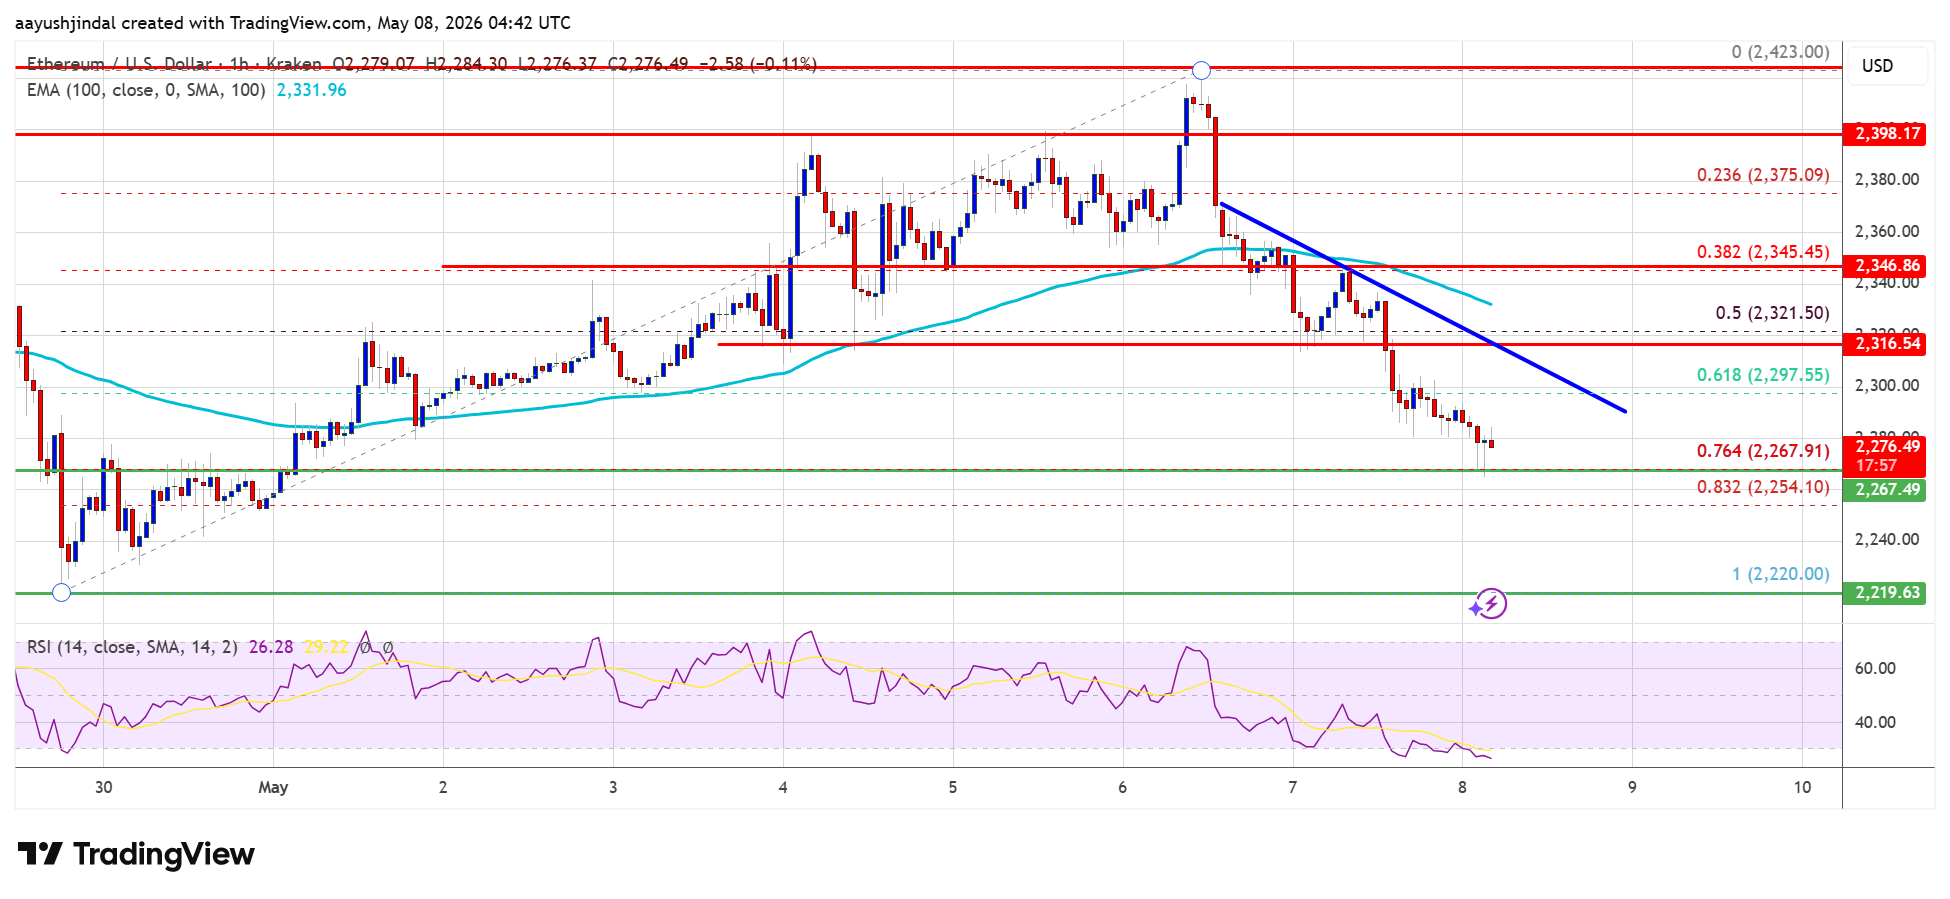
- There is a bearish trend line forming with resistance at $2,315 on the hourly chart of ETH/USD (data feed via Kraken).
- The pair could continue to move down if it stays below the $2,325 zone.
Ethereum price failed to stay above the $2,350 zone and extended its decline, like Bitcoin. ETH price gained pace for a move below the $2,320 and $2,300 levels.
The bears pushed the price below the 50% Fib retracement level of the upward move from the $2,220 swing low to the $2,423 high. Finally, the bulls appeared near $2,265. Besides, there is a bearish trend line forming with resistance at $2,315 on the hourly chart of ETH/USD.
Ethereum price is now trading below $2,320 and the 100-hourly Simple Moving Average. If the bulls remain in action above $2,265, the price could attempt another increase. Immediate resistance is seen near the $2,300 level. The first key resistance is near the $2,320 level.
The next major resistance is near the $2,350 level. A clear move above the $2,350 resistance might send the price toward the $2,400 resistance. An upside break above the $2,400 region might call for more gains in the coming days. In the stated case, Ether could rise toward the $2,440 resistance zone or even $2,450 in the near term.
Another Decline In ETH?If Ethereum fails to clear the $2,320 resistance, it could start a fresh decline. Initial support on the downside is near the $2,265 level and the 76.4% Fib retracement level of the upward move from the $2,220 swing low to the $2,423 high. The first major support sits near the $2,240 zone.
A clear move below the $2,240 support might push the price toward the $2,220 support. Any more losses might send the price toward the $2,200 region. The main support could be $2,150.
Technical Indicators
Hourly MACD – The MACD for ETH/USD is gaining momentum in the bearish zone.
Hourly RSI – The RSI for ETH/USD is now below the 50 zone.
Major Support Level – $2,265
Major Resistance Level – $2,320
Original source
Read on NewsBTCRelated market context

Ethereum Nears 200 Million Non-Empty Wallets Despite Market Uncertainty
Despite persistent market uncertainty and bearish sentiment across parts of the cryptocurrency sector, Ethereum is approaching a s...

Kraken Adds USDCx Support On Canton As Institutional Stablecoin Rails Expand
TL;DR Kraken says it now supports USDCx deposits and withdrawals on the Canton Network. USDCx is described as a Canton-native stab...

Ethereum Price Prediction: 3 Million ETH Rushes Into Staking as Sellers Vanish
Is nobody leaving Ethereum? A record 36 million ETH is now locked in staking, roughly 29–30% of the circulating supply, and the va...

Kraken Becomes Official Crypto Exchange Supporter Of FIFA World Cup 2026
TL;DR Kraken says it has become the Official Crypto Exchange Supporter of the FIFA World Cup 2026. The tournament expands to 48 te...

XRP aims for $0.90 as ETF demand battles selling pressure from whales
XRP is trading at $1.11, down roughly 17% from its June opening, having set a new 2026 low on June 5 and shed $8 billion in market...

The 3-Part Impulse That Shows Where The XRP Price Is Headed Next
XRP bulls are trying to turn a brutal selloff into something bigger than a relief bounce. An interesting setup shows a possible th...