Ethereum Price Eyes Bullish Momentum: Is a Breakout Imminent?
Ethereum price is attempting a fresh increase wave above $2,300. ETH might gain bullish momentum if it clears the $2,400 resistance zone. Ethereum is attempting a recovery wave above the $2,300 zone. The price is trading...

Ethereum price is attempting a fresh increase wave above $2,300. ETH might gain bullish momentum if it clears the $2,400 resistance zone.
- Ethereum is attempting a recovery wave above the $2,300 zone.
- The price is trading above $2,330 and the 100-hourly Simple Moving Average.
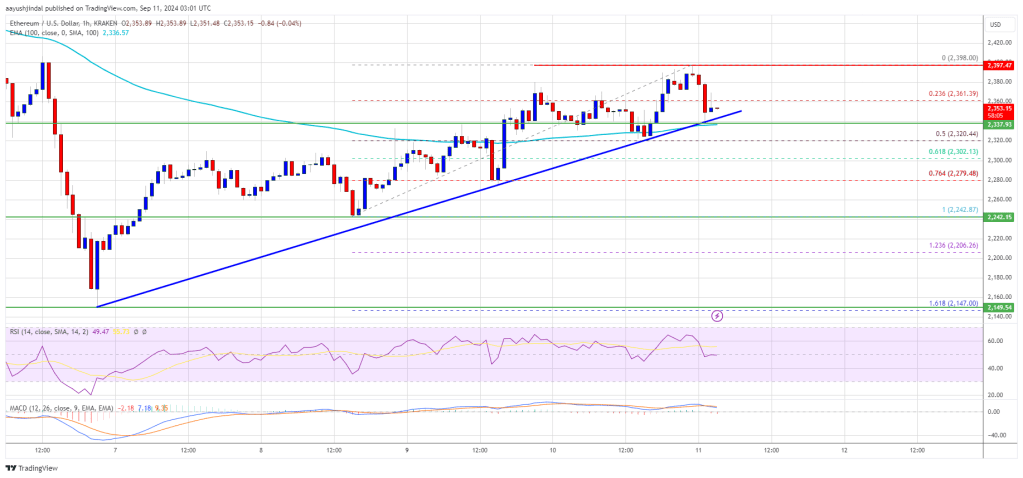
- There is a connecting bullish trend line forming with support at $2,335 on the hourly chart of ETH/USD (data feed via Kraken).
- The pair must clear the $2,400 resistance to continue higher in the near term.
Ethereum price started a recovery wave above the $2,300 level. ETH was able to clear the $2,320 resistance zone to move into a positive zone like Bitcoin. However, the bears were active near the $2,400 resistance.
A high was formed at $2,398 and the price is now consolidating gains. There was a minor decline below the $2,360 level. The price dipped below the 23.6% Fib retracement level of the upward move from the $2,242 swing low to the $2,398 high.
Ethereum price is now trading above $2,300 and the 100-hourly Simple Moving Average. There is also a connecting bullish trend line forming with support at $2,335 on the hourly chart of ETH/USD.
On the upside, the price seems to be facing hurdles near the $2,380 level. The first major resistance is near the $2,400 level. A close above the $2,400 level might send Ether toward the $2,465 resistance. The next key resistance is near $2,500. An upside break above the $2,500 resistance might call for more gains toward the $2,550 resistance zone in the near term.
Another Decline In ETH?If Ethereum fails to clear the $2,400 resistance, it could start another decline. Initial support on the downside is near $2,335 and the trend line. The first major support sits near the $2,300 zone or the 61.8% Fib retracement level of the upward move from the $2,242 swing low to the $2,398 high.
A clear move below the $2,300 support might push the price toward $2,240. Any more losses might send the price toward the $2,150 support level in the near term. The next key support sits at $2,050.
Technical Indicators
Hourly MACD – The MACD for ETH/USD is losing momentum in the bullish zone.
Hourly RSI – The RSI for ETH/USD is now above the 50 zone.
Major Support Level – $2,240
Major Resistance Level – $2,400
Original source
Read on NewsBTCRelated market context

Standard Chartered Says Bitcoin Bottomed Near $59,000 As Crypto Winter Ends
TL;DR Standard Chartered’s Geoffrey Kendrick reportedly says Bitcoin’s $59,000 area marked the cycle bottom. The note cites SpaceX...

XRP Price Prediction: Japan XRP ETF Listing is Getting Closer
Japan just handed XRP bulls a major regulatory tailwind. XRP price is retesting a congestion zone, and the prediction could turn b...

Google Gemini AI Predicts Jaw-Dropping XRP Price For Next 90 Days
Google Gemini AI just put XRP back under the spotlight, predicting it is tightly wound for a major breakout toward $1.60 to $1.80...

Bitcoin price challenges $64,000 weekend wall – needing a breakout or risk a deeper correction
Bitcoin reclaimed $64,000 on June 12 and touched an intraday high of $64,301 in the same session that spot ETF flows finally flipp...

Elon Musk SpaceX AI Predicts Incredible Bitcoin Price For Next 30 Days
Here is the thing about capitulation calls. They only sound smart in hindsight. Right now, with Bitcoin price scraping along the l...

Bitcoin rises above $64,000 after Pakistan prime minister says Iran peace deal is near
Bitcoin traded above $64,000 on Saturday, supported by its strongest ETF inflows in a month and growing optimism around geopolitic...