Ethereum Price Faces Downside Risk, Bears Prepare for Fresh Move
Ethereum price started a recovery wave above the $2,120 zone. ETH is now consolidating above $2,140 and is struggling to clear the $2,200 resistance. Ethereum started a recovery wave above the $2,150 zone. The price is t...

Ethereum price started a recovery wave above the $2,120 zone. ETH is now consolidating above $2,140 and is struggling to clear the $2,200 resistance.
- Ethereum started a recovery wave above the $2,150 zone.
- The price is trading above $2,120 and the 100-hourly Simple Moving Average.
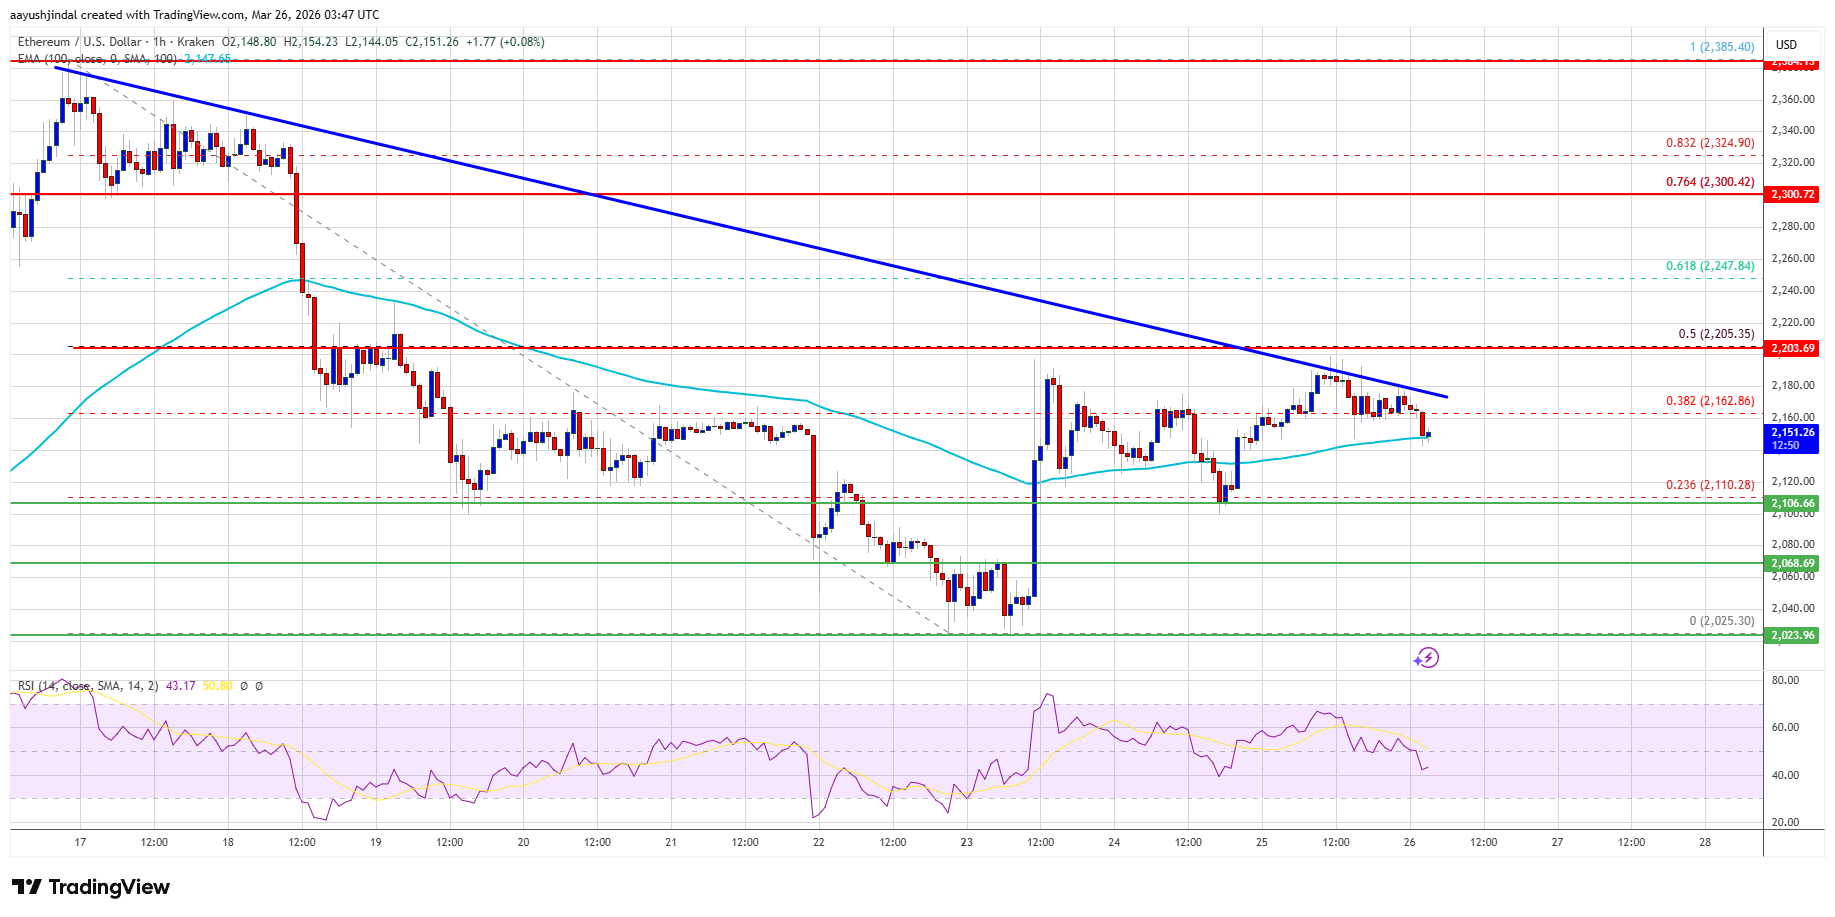
- There is a new bearish trend line with forming resistance at $2,175 on the hourly chart of ETH/USD (data feed via Kraken).
- The pair could start a fresh decline if it stays below the $2,205 resistance.
Ethereum price managed to stay above $2,050 and started a recovery wave, like Bitcoin. ETH price was able to climb above the $2,080 and $2,120 resistance levels.
The price cleared the 38.2% Fib retracement level of the downward move from the $2,385 swing high to the $2,025 low. However, the bears seem to be active below the $2,200 resistance. There is also a new bearish trend line with forming resistance at $2,175 on the hourly chart of ETH/USD.
Ethereum price is now trading above $2,140 and the 100-hourly Simple Moving Average. If the bulls remain in action above $2,100, the price could attempt another increase. Immediate resistance is seen near the $2,175 level and the trend line.
The first key resistance is near the $2,205 level or the 50% Fib retracement level of the downward move from the $2,385 swing high to the $2,025 low.
The next major resistance is near the $2,250 level. A clear move above the $2,250 resistance might send the price toward the $2,300 resistance. An upside break above the $2,300 region might call for more gains in the coming days. In the stated case, Ether could rise toward the $2,345 resistance zone or even $2,365 in the near term.
Another Drop In ETH?If Ethereum fails to clear the $2,175 resistance, it could start a fresh decline. Initial support on the downside is near the $2,120 level. The first major support sits near the $2,100 zone.
A clear move below the $2,100 support might push the price toward the $2,065 support. Any more losses might send the price toward the $2,020 region. The main support could be $2,000.
Technical Indicators
Hourly MACD – The MACD for ETH/USD is losing momentum in the bullish zone.
Hourly RSI – The RSI for ETH/USD is now below the 50 zone.
Major Support Level – $2,065
Major Resistance Level – $2,175
Original source
Read on NewsBTCRelated market context

Kraken Adds USDCx Support On Canton As Institutional Stablecoin Rails Expand
TL;DR Kraken says it now supports USDCx deposits and withdrawals on the Canton Network. USDCx is described as a Canton-native stab...

XRP Price Prediction: Japan XRP ETF Listing is Getting Closer
Japan just handed XRP bulls a major regulatory tailwind. XRP price is retesting a congestion zone, and the prediction could turn b...

Kraken Becomes Official Crypto Exchange Supporter Of FIFA World Cup 2026
TL;DR Kraken says it has become the Official Crypto Exchange Supporter of the FIFA World Cup 2026. The tournament expands to 48 te...

Ethereum Price Prediction: 3 Million ETH Rushes Into Staking as Sellers Vanish
Is nobody leaving Ethereum? A record 36 million ETH is now locked in staking, roughly 29–30% of the circulating supply, and the va...

XRP Price Prediction: Japan Regulates Crypto like Stocks, XRP to Benefit First
Japan just rewrote the rules. XRP price is battling below resistance at $1.10, but it’s prediction is getting bullish as Japan’s p...

Most Traders Will Scroll Past This Grok AI Bitcoin Predicts, Big Mistake
Elon Musk Grok AI just looked at a Bitcoin chart down more than 50% and predicts it’s a classic accumulation zone, targeting $150,...