Ethereum Price Inches Higher, Building Pressure for a Follow-Through
Ethereum price failed to clear the $3,220 resistance and dipped. ETH is now attempting to recover and faces an uphill task near the $3,150 level. Ethereum started a downside correction below $3,220 and $3,200. The price...
Archive context
Older archive item. Useful for background and entity history, but not a fresh market-moving signal.

Ethereum price failed to clear the $3,220 resistance and dipped. ETH is now attempting to recover and faces an uphill task near the $3,150 level.
- Ethereum started a downside correction below $3,220 and $3,200.
- The price is trading below $3,180 and the 100-hourly Simple Moving Average.
- There was a break above a connecting bearish trend line with resistance at $3,100 on the hourly chart of ETH/USD (data feed via Kraken).
- The pair could continue to move up if it stays above the $3,050 zone.
Ethereum price failed to remain stable above $3,220 and dipped further, like Bitcoin. ETH price declined below $3,200 and $3,120 to enter a short-term bearish zone.
The price even dipped below $3,120. A low was formed at $3,050, and the price is now consolidating losses. It tested the 23.6% Fib retracement level of the recent decline from the $3,308 swing high to the $3,050 low. Besides, there was a break above a connecting bearish trend line with resistance at $3,100 on the hourly chart of ETH/USD.
Ethereum price is now trading below $3,180 and the 100-hourly Simple Moving Average. If the bulls can protect more losses below $3,050, the price could attempt another increase. Immediate resistance is seen near the $3,150 level.
The first key resistance is near the $3,180 level and the 50% Fib retracement level of the recent decline from the $3,308 swing high to the $3,050 low. The next major resistance is near the $3,210 level.
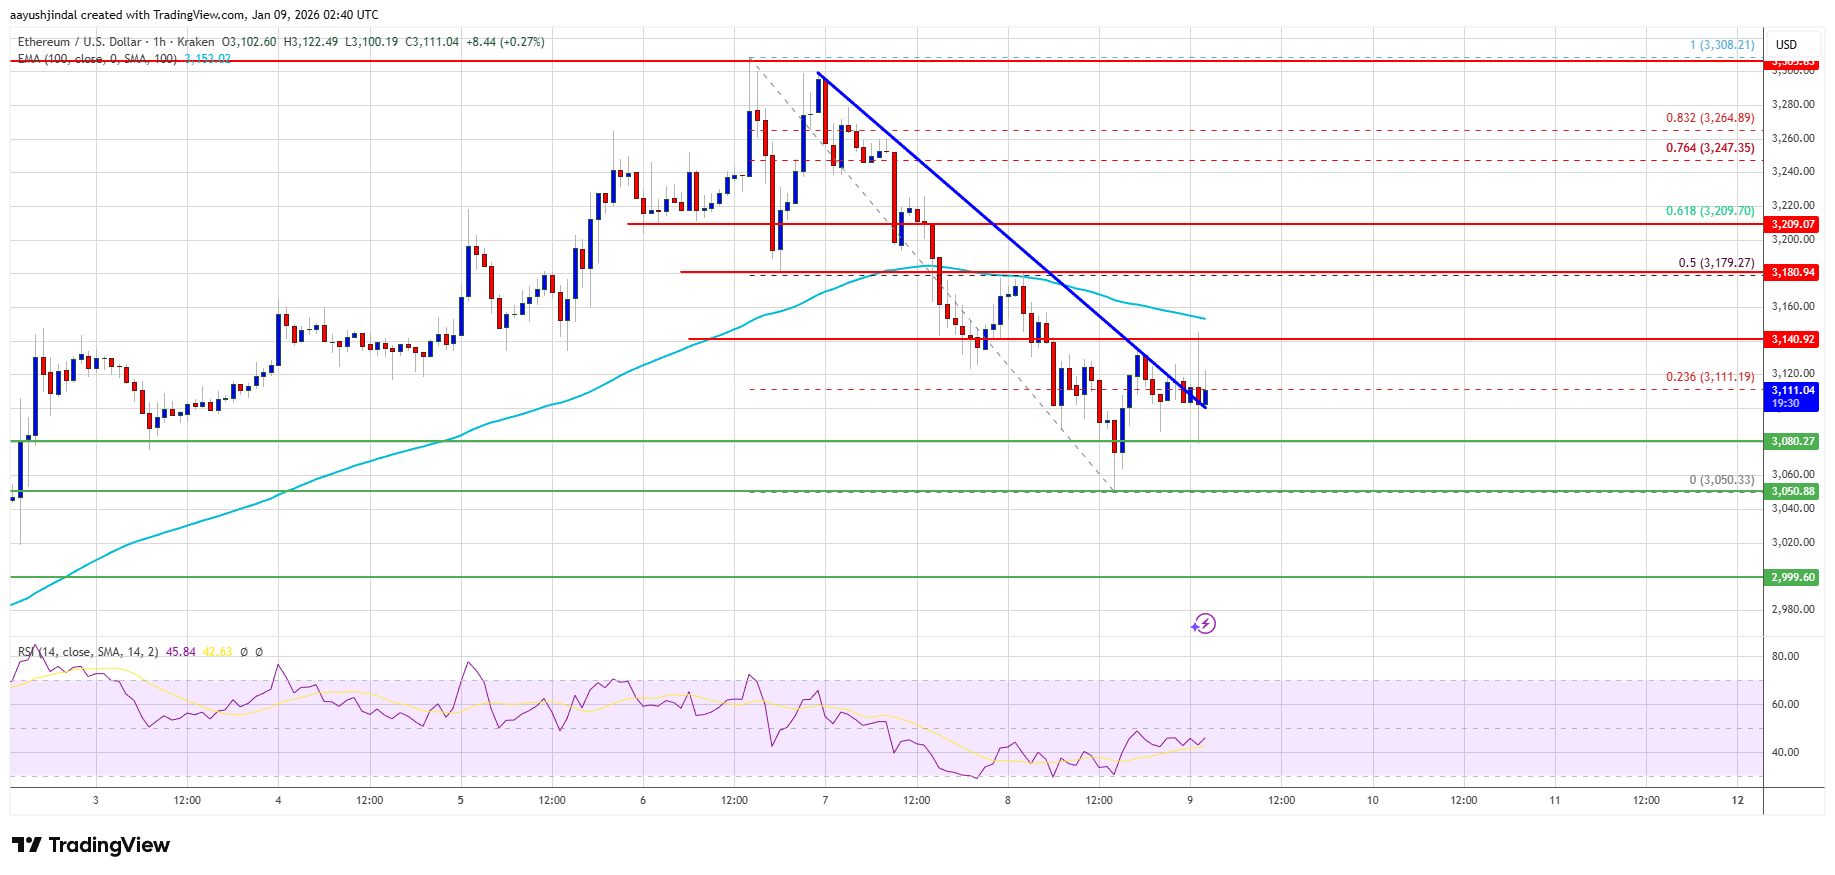
A clear move above the $3,210 resistance might send the price toward the $3,250 resistance. An upside break above the $3,250 region might call for more gains in the coming days. In the stated case, Ether could rise toward the $3,300 resistance zone or even $3,320 in the near term.
Another Decline In ETH?If Ethereum fails to clear the $3,180 resistance, it could start a fresh decline. Initial support on the downside is near the $3,080 level. The first major support sits near the $3,050 zone.
A clear move below the $3,050 support might push the price toward the $3,020 support. Any more losses might send the price toward the $3,000 region.
Technical Indicators
Hourly MACD – The MACD for ETH/USD is gaining momentum in the bullish zone.
Hourly RSI – The RSI for ETH/USD is now below the 50 zone.
Major Support Level – $3,050
Major Resistance Level – $3,180
Why this matters
Ethereum is a tracked market entity in the DigitalMoneyBox archive, making this useful context for readers monitoring repeated mentions and follow-up coverage.
Original source
Read on NewsBTCRelated market context

Ethereum (ETH) Price Prediction: ETH Holds Near $2,500 as ETF Flows Turn Positive and Long Positions Reach Four-Year High
Ethereum is holding close to $2,500 after a volatile start to October, with the market now showing a mixture of improving institut...

Why Is XRP Down Today? Bears Target $1.30 Support as Selling Pressure Builds
The downturn has weakened XRP’s short-term technical structure, leaving traders focused on whether buyers can defend nearby suppor...

Ethereum Price Prediction: Tom Lee Warns of ETH Drawdown After Kospi Bloodbath
Ethereum is trading at the $2,500 level as Tom Lee warns that Korea’s equity rout could spill into crypto, a bearish price predict...

Bitcoin (BTC) Price Prediction: Slowing Whale Selling Offers Hope as $81.5K ETF Support Holds
On-chain data indicates that distribution from longer-term holders has slowed, offering some relief to the market. However, weaken...

Sam Altman ChatGPT AI Predicts that BTC Could Hit $1.8M by 2027
Sam Altman OpenAI ChatGPT AI predicts that Bitcoin could reach $1.8M by January 1, 2027. This over-the-top bullish prediction clai...

XRP Price Faces Test Despite Improving Social Mood
XRP recorded 0.92 bullish comments for every bearish comment in Santiment’s October 13 reading, even as the token price fell more...