Ethereum Price Looks Ready For Another Leg Higher Over $1,300
Ethereum was able to clear the $1,240 resistance zone against the US Dollar. ETH is showing positive signs and there might be a move above the $1,300 resistance. Ethereum is moving higher above the $1,220 and $1,240 resi...

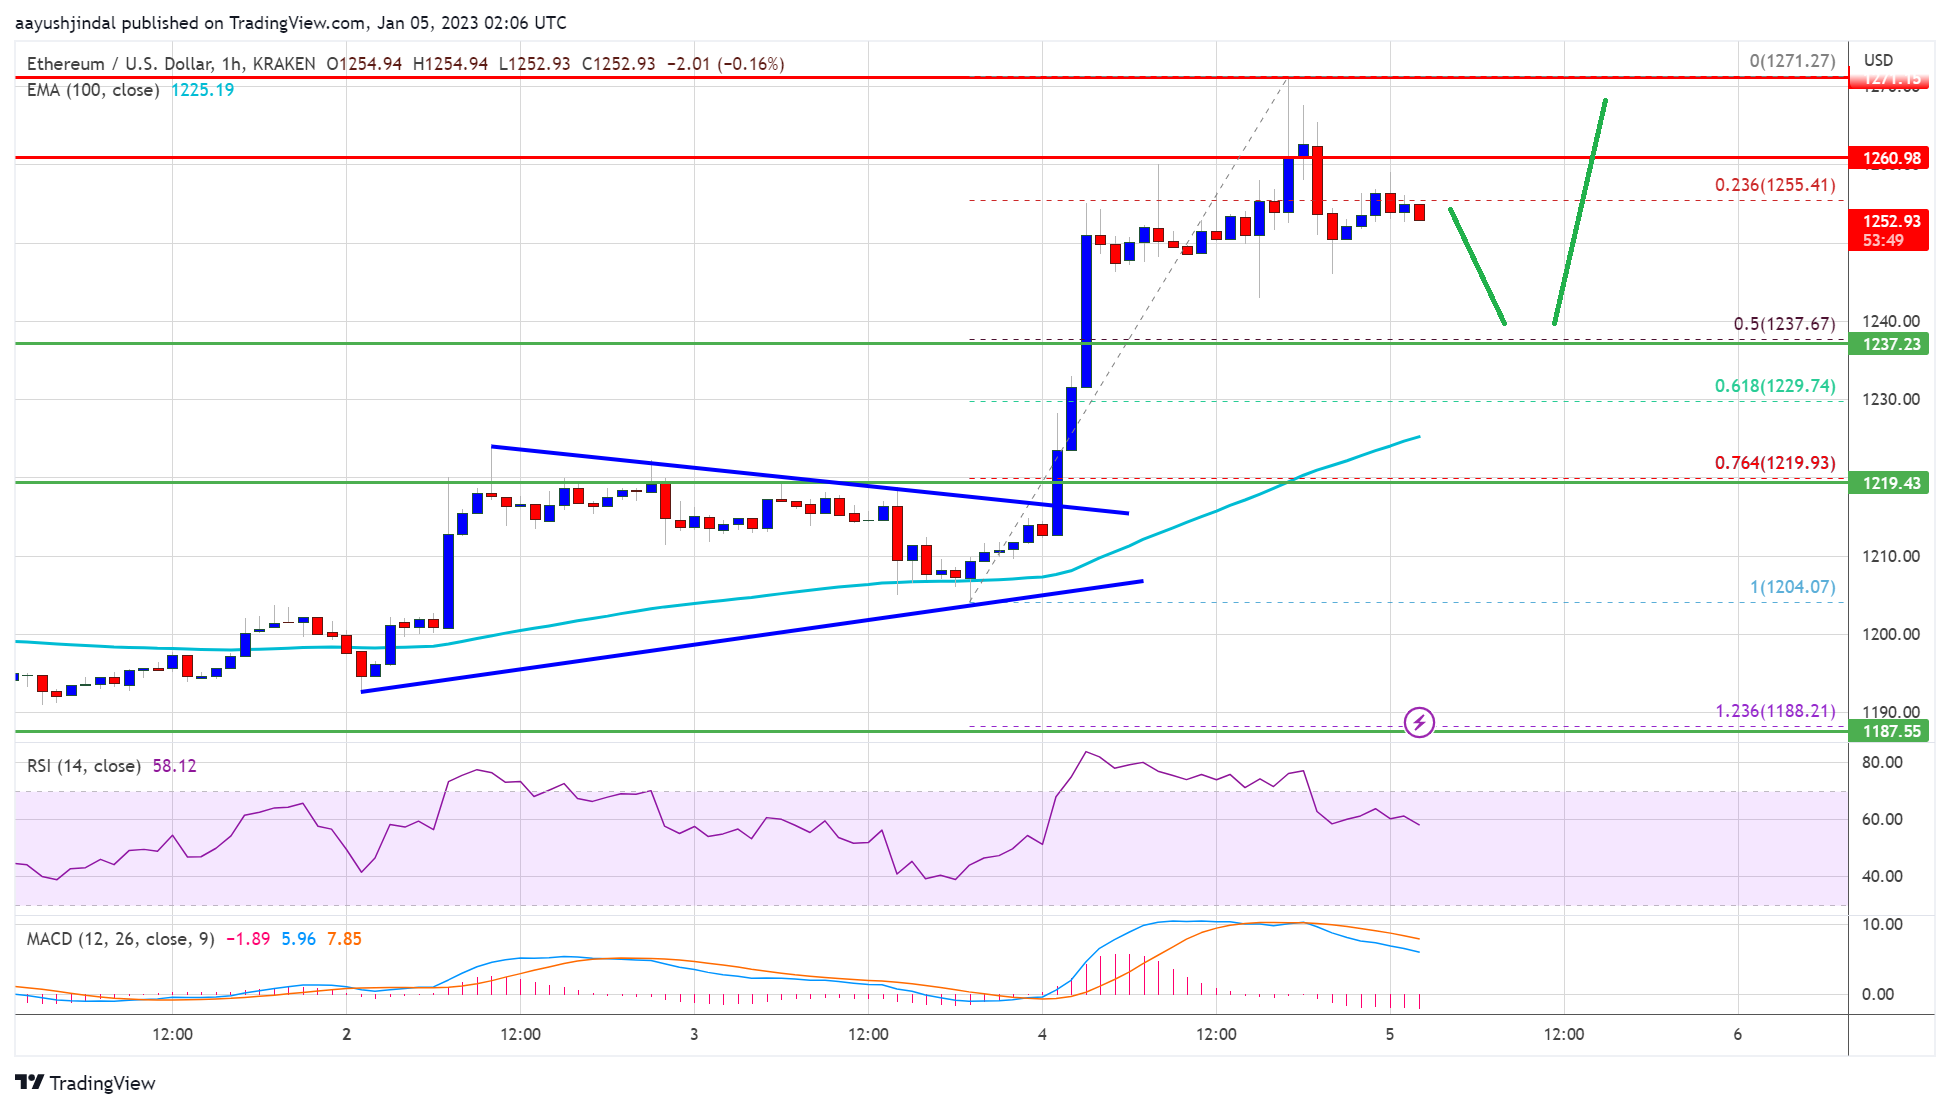
Ethereum was able to clear the $1,240 resistance zone against the US Dollar. ETH is showing positive signs and there might be a move above the $1,300 resistance.
- Ethereum is moving higher above the $1,220 and $1,240 resistance levels.
- The price is now trading above $1,220 and the 100 hourly simple moving average.
- There was a break above a key contracting triangle with resistance near $1,215 on the hourly chart of ETH/USD (data feed via Kraken).
- The pair could rise further if there is a clear move above the $1,300 resistance.
Ethereum price formed a base above the $1,200 level. ETH started a decent increase and was able to clear the $1,220 resistance zone, similar to bitcoin.
There was a break above a key contracting triangle with resistance near $1,215 on the hourly chart of ETH/USD. It opened the doors for a move above the $1,250 resistance zone. The price tested the $1,270 zone and a high is formed near $1,271.
Ether price is now trading above $1,220 and the 100 hourly simple moving average. It is now correcting gains below $1,260. There was a move below the 23.6% Fib retracement level of the recent increase from the $1,204 swing low to $1,271 high.
Source: ETHUSD on TradingView.com
An immediate resistance is near the $1,260 level. The next major resistance is near the $1,275 level. A clear move above the $1,275 resistance could another upward move. In the stated case, the price may perhaps rise towards the $1,300 resistance. The next major resistance could be $1,350, above which the price could surge towards the $1,420 resistance zone.
Dips Limited in ETH?If ethereum fails to clear the $1,275 resistance, it could correct further lower. An initial support on the downside is near the $1,240 level.
The next major support is near the $1,230 level. It is near the 50% Fib retracement level of the recent increase from the $1,204 swing low to $1,271 high. A downside break below $1,230 might send the price towards the $1,220 support. Any more losses might call for a test of the $1,200 zone.
Technical Indicators
Hourly MACD – The MACD for ETH/USD is now losing momentum in the bullish zone.
Hourly RSI – The RSI for ETH/USD is now above the 50 level.
Major Support Level – $1,230
Major Resistance Level – $1,275
Original source
Read on NewsBTCRelated market context

Standard Chartered Says Bitcoin Bottomed Near $59,000 As Crypto Winter Ends
TL;DR Standard Chartered’s Geoffrey Kendrick reportedly says Bitcoin’s $59,000 area marked the cycle bottom. The note cites SpaceX...

Blackrock’s IBIT Leads $86 Million Bitcoin ETF Inflow as Ethereum Funds Extend Outflow Streak
Spot bitcoin exchange-traded funds (ETFs) drew $85.85 million in net inflows on Friday, with every one of the 12 tracked funds avo...

Kraken Adds USDCx Support On Canton As Institutional Stablecoin Rails Expand
TL;DR Kraken says it now supports USDCx deposits and withdrawals on the Canton Network. USDCx is described as a Canton-native stab...

Elon Musk SpaceX AI Predicts Incredible Bitcoin Price For Next 30 Days
Here is the thing about capitulation calls. They only sound smart in hindsight. Right now, with Bitcoin price scraping along the l...

Michael Saylor says investor confidence in Ethereum has collapsed
Ethereum's declining investor confidence signals a shift towards Bitcoin dominance, emphasizing real-world utility over speculativ...

Ethereum Foundation’s Kohaku proposes post-quantum account protection for $0.07
Kohaku's opt-in quantum protection could accelerate Ethereum's security evolution, influencing investor confidence and market dyna...