Ethereum Price Poised At Critical Threshold With Directional Move Pending
Ethereum price found support near $1,905 and recovered some losses. ETH is now consolidating and faces key hurdles near $1,980. Ethereum is attempting a fresh recovery wave above $1,950. The price is trading below $1,980...
Archive context
Older archive item. Useful for background and entity history, but not a fresh market-moving signal.

Ethereum price found support near $1,905 and recovered some losses. ETH is now consolidating and faces key hurdles near $1,980.
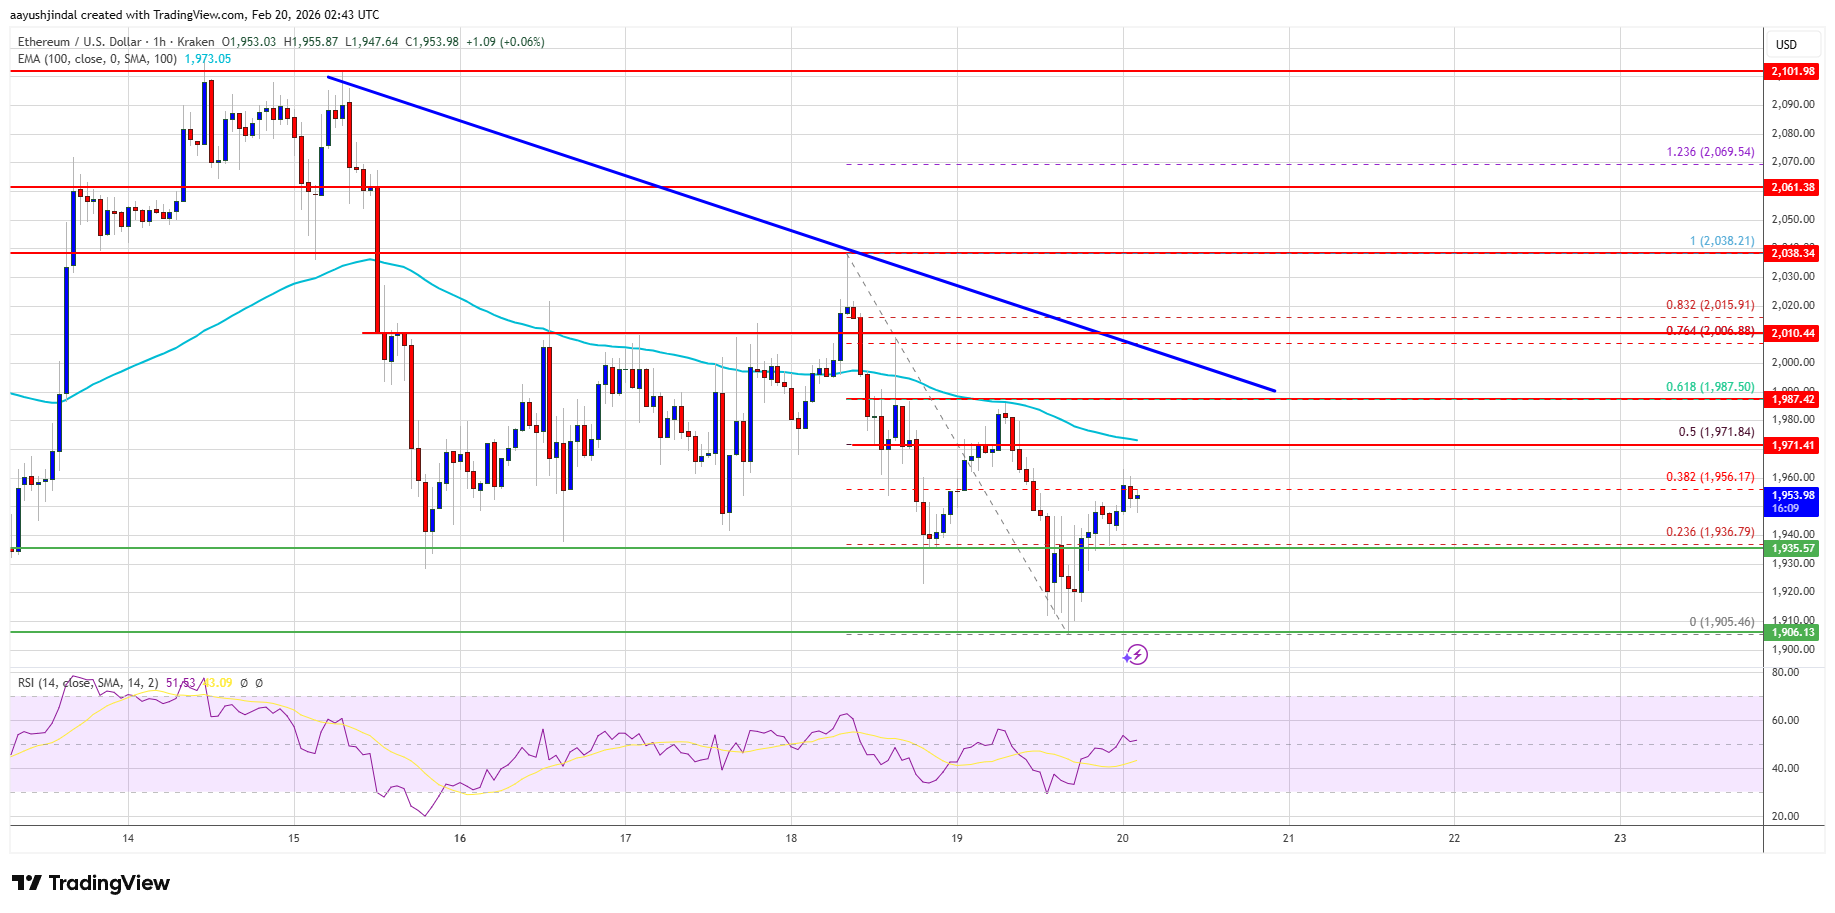
- Ethereum is attempting a fresh recovery wave above $1,950.
- The price is trading below $1,980 and the 100-hourly Simple Moving Average.
- There is a bearish trend line forming with resistance at $1,985 on the hourly chart of ETH/USD (data feed via Kraken).
- The pair could start a fresh decline if it stays below the $2,000 zone.
Ethereum price failed to stay above $1,950 and started a fresh decline, like Bitcoin. ETH price traded below the $1,935 and $1,920 levels to enter a bearish zone.
Finally, the bulls appeared near $1,900. A low was formed at $1,905, and the price started a recovery wave. There was a move above the $1,945 resistance. The price tested the 38.2% Fib retracement level of the downward move from the $2,038 swing high to the $1,905 low.
Ethereum price is now trading below $1,970 and the 100-hourly Simple Moving Average. If the bulls remain in action above $1,920, the price could attempt another increase. Immediate resistance is seen near the $1,970 level and the 50% Fib retracement level of the downward move from the $2,038 swing high to the $1,905 low.
The first key resistance is near the $1,985 level. There is also a bearish trend line forming with resistance at $1,985 on the hourly chart of ETH/USD. The next major resistance is near the $2,000 level. A clear move above the $2,000 resistance might send the price toward the $2,050 resistance. An upside break above the $2,050 region might call for more gains in the coming days. In the stated case, Ether could rise toward the $2,120 resistance zone or even $2,150 in the near term.
Another Decline In ETH?If Ethereum fails to clear the $1,985 resistance, it could start a fresh decline. Initial support on the downside is near the $1,935 level. The first major support sits near the $1,905 zone.
A clear move below the $1,905 support might push the price toward the $1,880 support. Any more losses might send the price toward the $1,840 region. The main support could be $1,820.
Technical Indicators
Hourly MACD – The MACD for ETH/USD is losing momentum in the bullish zone.
Hourly RSI – The RSI for ETH/USD is now above the 50 zone.
Major Support Level – $1,905
Major Resistance Level – $1,985
Why this matters
Ethereum is a tracked market entity in the DigitalMoneyBox archive, making this useful context for readers monitoring repeated mentions and follow-up coverage.
Original source
Read on NewsBTCRelated market context

XRP Price Prediction: 1 Billion Unlock Fails to Suppress Rally as Ripple Pushes Above Key Resistance
Ripple’s latest 1 billion XRP escrow release arrived this week, yet the coin price barely blinked. XRP trades around $1.06, up abo...

Ethereum Price Prediction: Lubin, Bitmine, and Sharplink Launch Independent Non-Profit Institution to Bring Institutional Wealth Onchain
Ethereum price is trading near $1,650, remaining below its major moving averages and preserving a bearish prediction. However, the...

Crypto News, July 2: Circle USDC Hit by Blackrock and Ripple XRP Backed OUSD, Bitcoin and Ethereum Price Recovering
Market do what market does, crypto is looking slightly better after taking a few beatings last month. Price is grinding higher des...

Ethereum is splitting into three power centers and ETH treasury firms are paying for two
Ethereum Institutional announced its launch on July 1, folding a year of the Foundation's go-to-market work into a group pitching...

Ethlabs Launches with Five Former Ethereum Foundation Researchers to Speed Up Settlement
This is not just another ticker-level move. It points to a deeper shift in how capital, infrastructure, or regulation is moving th...

Ethereum Institutional Backers Launch Independent Non-Profit to Target Wall Street Wealth
Crypto markets have had plenty to digest today, and this development adds another layer to the picture. Ethereum Institutional Bac...