Ethereum Price Rebound Runs Out Of Fuel Near Key Resistance
Ethereum price started a recovery wave above the $1,620 zone. ETH is now consolidating and struggling to continue higher above the $1,700 resistance. Ethereum started a recovery wave above the $1,620 zone. The price is t...
Archive context
Older archive item. Useful for background and entity history, but not a fresh market-moving signal.

Ethereum price started a recovery wave above the $1,620 zone. ETH is now consolidating and struggling to continue higher above the $1,700 resistance.
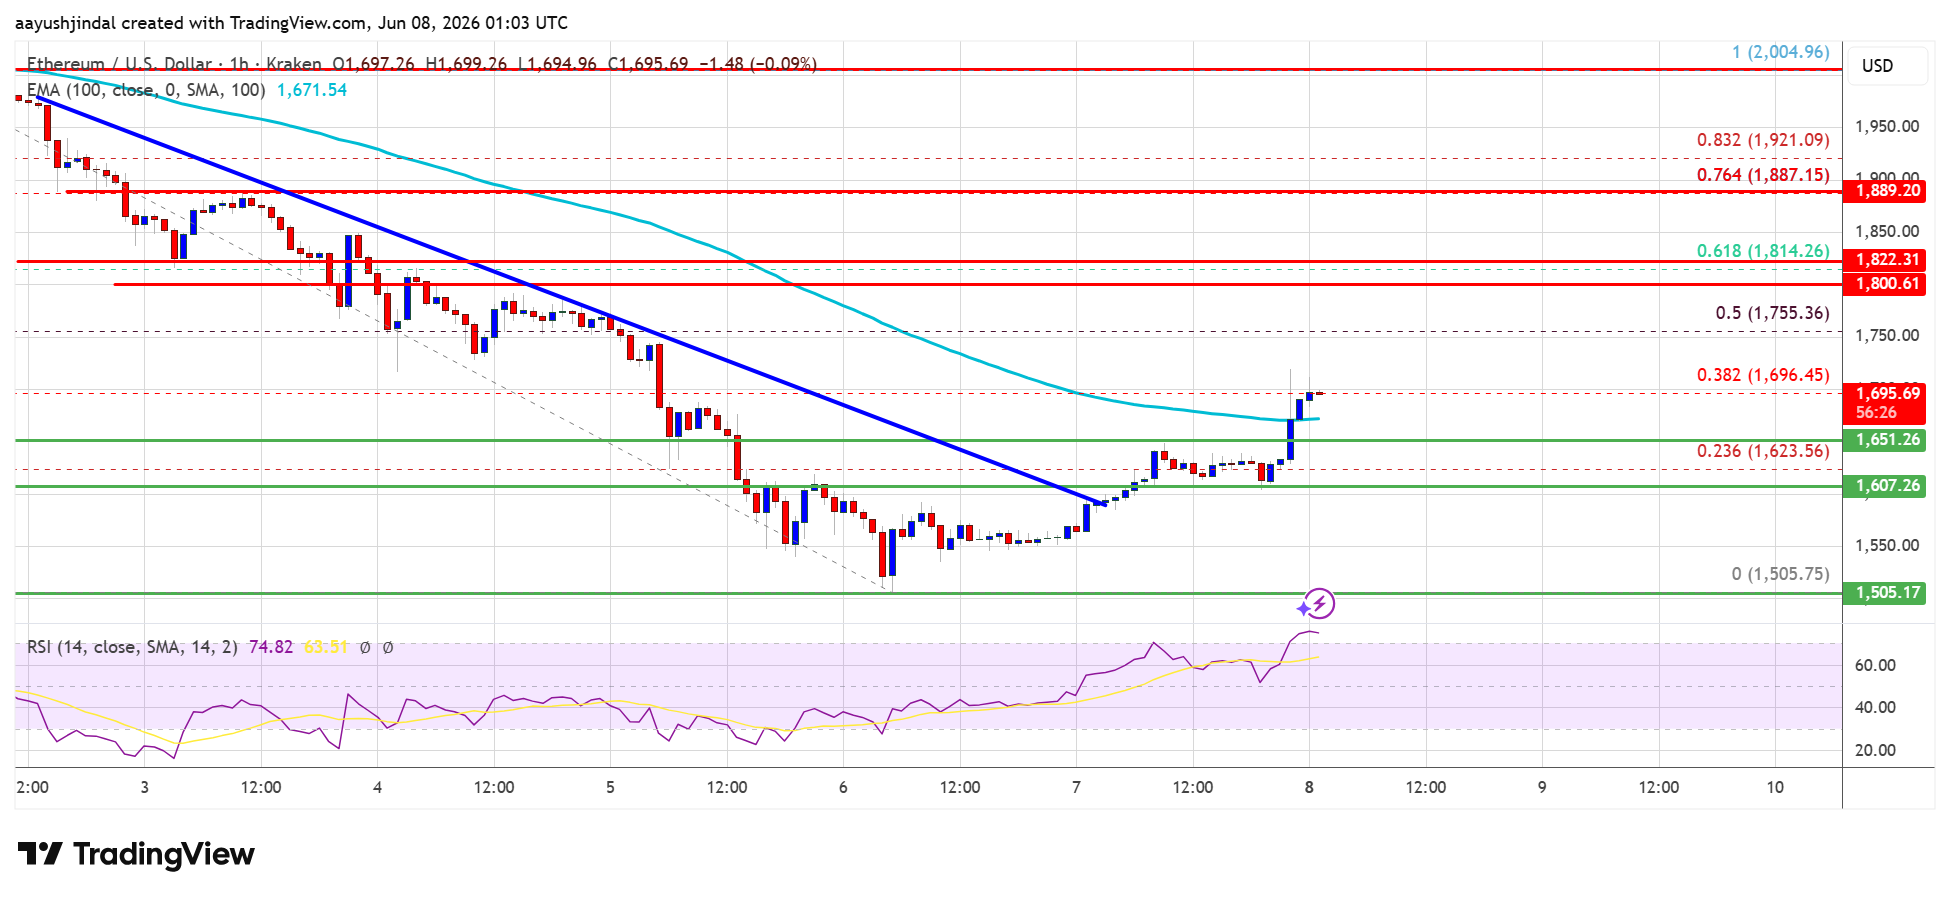
- Ethereum started a recovery wave above the $1,620 zone.
- The price is trading below $1,680 and the 100-hourly Simple Moving Average.
- There was a break below a bullish trend line with support at $1,685 on the hourly chart of ETH/USD (data feed via Kraken).
- The pair could start a fresh decline if it stays below the $1,700 zone.
Ethereum price started a recovery wave above the $1,520 zone, like Bitcoin. ETH price was able to surpass and settle above the $1,620 resistance.
The price surpassed the 23.6% Fib retracement level of the downward move from the $2,005 swing high to the $1,505 swing low. However, the bears remained active near the $1,700 resistance. As a result, there was a fresh bearish reaction. Besides, there was a break below a bullish trend line with support at $1,685 on the hourly chart of ETH/USD.
Ethereum price is now trading below $1,680 and the 100-hourly Simple Moving Average. If the bulls remain in action above $1,650, the price could attempt another increase. Immediate resistance is seen near the $1,680 level. The first key resistance is near the $1,700 level.
The next major resistance is near the $1,750 level or the 50% Fib retracement level of the downward move from the $2,005 swing high to the $1,505 swing low. A clear move above the $1,750 resistance might send the price toward the $1,800 resistance. An upside break above the $1,800 region might call for more gains in the coming days. In the stated case, Ether could rise toward the $1,840 resistance zone or even $1,880 in the near term.
Downside Continuation In ETH?If Ethereum fails to clear the $1,700 resistance, it could start a fresh decline. Initial support on the downside is near the $1,650 level. The first major support sits near the $1,620 zone.
A clear move below the $1,620 support might push the price toward the $1,580 support. Any more losses might send the price toward the $1,550 region. The main support could be $1,500.
Technical Indicators
Hourly MACD – The MACD for ETH/USD is gaining momentum in the bearish zone.
Hourly RSI – The RSI for ETH/USD is now below the 50 zone.
Major Support Level – $1,650
Major Resistance Level – $1,700
Why this matters
Ethereum is a tracked market entity in the DigitalMoneyBox archive, making this useful context for readers monitoring repeated mentions and follow-up coverage.
Original source
Read on NewsBTCRelated market context

Ethereum Price in Limbo as Bitmine Inches Away From Its 5% Supply Target
Ethereum price is trading at $1,880, down 3.3% on the day after slipping from recent highs. The market remains caught between stea...

Bitcoin Price Prediction: BTC Falls Below $64K as Fed Rate-Hike Fears Intensify
According to Brave New Coin data, Bitcoin Price dropped as much as 2.3% to around $63,368 during early Asian trading, its lowest l...

South Korea’s Stock Market Triggered 8th Circuit Breaker of 2026: Bitcoin Liquidated 3 Times Near $64,000
Bitcoin News: BTC price is trading at $63,582 on July 28, down 2.12% in the past 24 hours, and the level that keeps breaking trade...

Google Gemini AI Predicts Why XRP Could Outperform Every Crypto by End of 2026
Google Gemini AI language on this predicts is unusually direct. Trading near $1.08, XRP sits at the precipice of a major instituti...

XRP Price Prediction: Fed Rate Decision and Ripple ETF Flow
XRP prediction remains mixed as its price trades near $1.5, down about 5% over the past 24 hours, while traders await the Federal...

Arthur Hayes Holds 7,213 ETH as FOMC Jitters Drives Ethereum Price Drop
Arthur Hayes added 3,298 ETH worth $6.39 million on July 28, roughly three hours before Ethereum’s spot price slid from $1,960 to...