Ethereum Price Rejected Near $2,400 Again, Sellers Defend Key Barrier
Ethereum price started a downside correction from $2,380. ETH is now showing a few bearish signs and might decline further if it trades below $2,300. Ethereum started a downside correction below the $2,360 zone. The pric...

Ethereum price started a downside correction from $2,380. ETH is now showing a few bearish signs and might decline further if it trades below $2,300.
- Ethereum started a downside correction below the $2,360 zone.
- The price is trading below $2,350 and the 100-hourly Simple Moving Average.
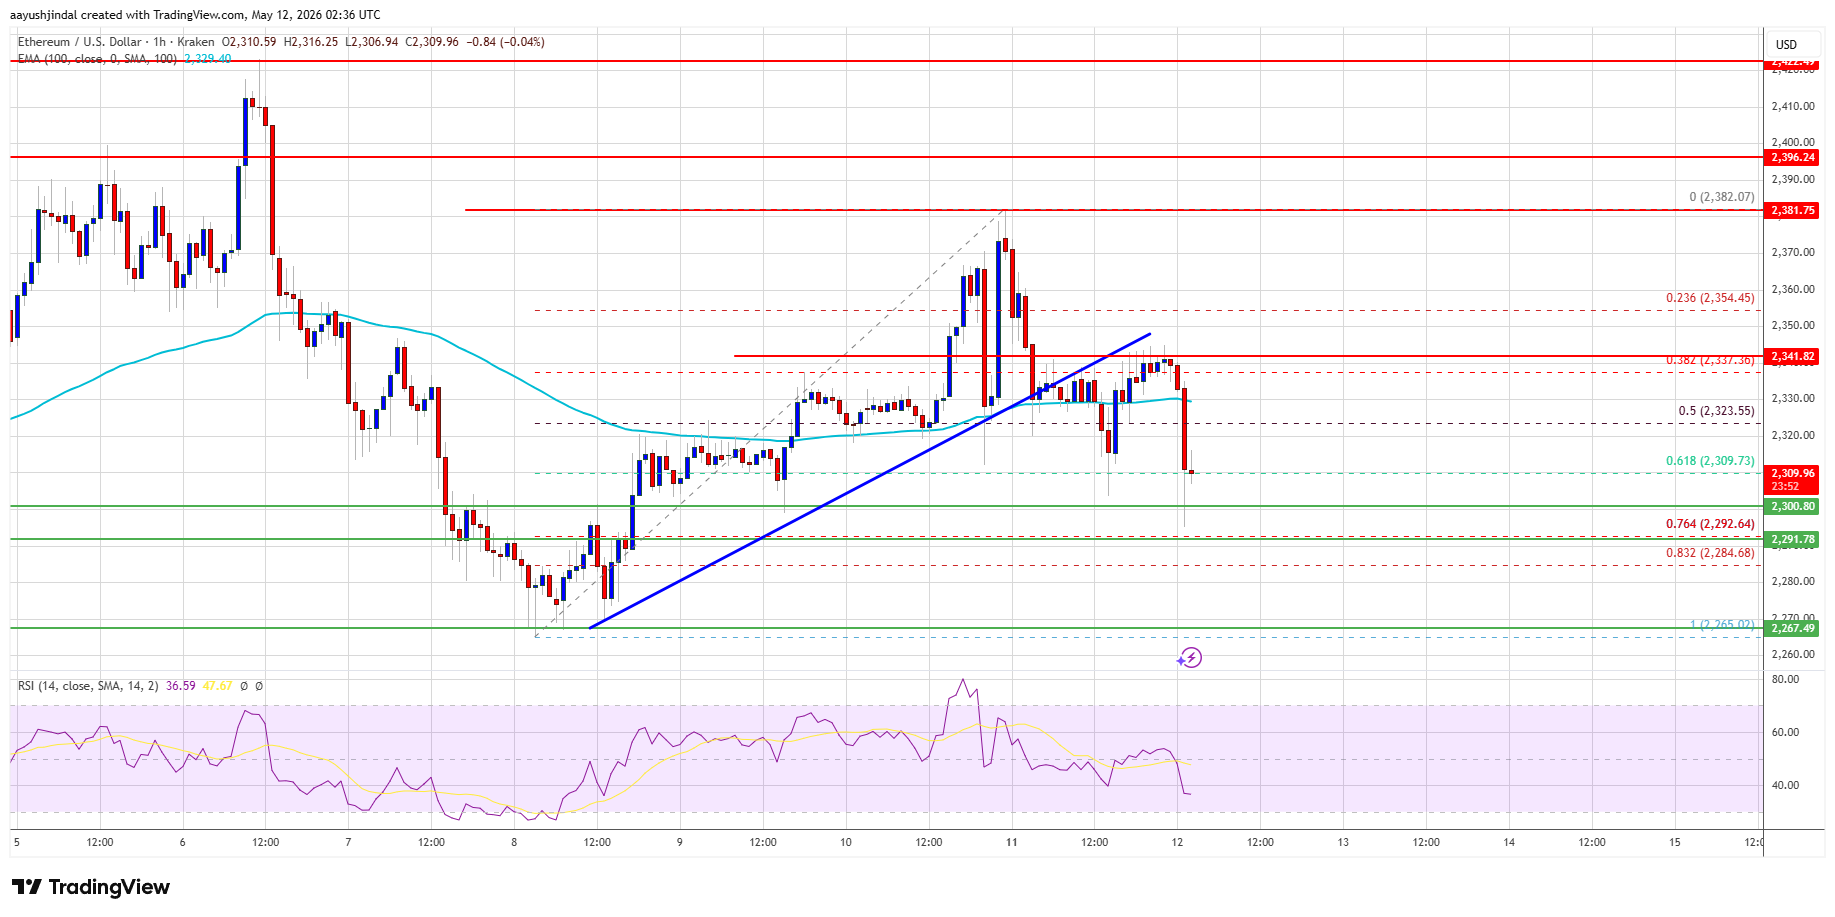
- There was a break below a bullish trend line with support at $2,340 on the hourly chart of ETH/USD (data feed via Kraken).
- The pair could continue to move down if it stays below the $2,350 zone.
Ethereum price failed to stay above the $2,365 zone and extended its decline, like Bitcoin. ETH price gained pace for a move below the $2,350 and $2,340 levels.
There was a break below a bullish trend line with support at $2,340 on the hourly chart of ETH/USD. The bears pushed the price below the 50% Fib retracement level of the upward move from the $2,265 swing low to the $2,382 high.
Finally, the bulls appeared near $2,300. Ethereum price is now trading below $2,340 and the 100-hourly Simple Moving Average. If the bulls remain in action above $2,300, the price could attempt another increase. Immediate resistance is seen near the $2,340 level. The first key resistance is near the $2,365 level.
The next major resistance is near the $2,380 level. A clear move above the $2,380 resistance might send the price toward the $2,400 resistance. An upside break above the $2,400 region might call for more gains in the coming days. In the stated case, Ether could rise toward the $2,440 resistance zone or even $2,450 in the near term.
More Downside In ETH?If Ethereum fails to clear the $2,350 resistance, it could start a fresh decline. Initial support on the downside is near the $2,300 level and the 76.4% Fib retracement level of the upward move from the $2,265 swing low to the $2,382 high. The first major support sits near the $2,265 zone.
A clear move below the $2,265 support might push the price toward the $2,220 support. Any more losses might send the price toward the $2,200 region. The main support could be $2,150.
Technical Indicators
Hourly MACD – The MACD for ETH/USD is gaining momentum in the bearish zone.
Hourly RSI – The RSI for ETH/USD is now below the 50 zone.
Major Support Level – $2,300
Major Resistance Level – $2,380
Original source
Read on NewsBTCRelated market context

Bitcoin (BTC) Price Prediction: BTC Eyes $70K Liquidity Sweep as Whales Reclaim Control Near $62K
Market data suggests that long-term holders remain largely inactive, while whale activity is beginning to recover, creating an int...

Ethereum Nears 200 Million Non-Empty Wallets Despite Market Uncertainty
Despite persistent market uncertainty and bearish sentiment across parts of the cryptocurrency sector, Ethereum is approaching a s...

Ethereum Price Prediction: 3 Million ETH Rushes Into Staking as Sellers Vanish
Is nobody leaving Ethereum? A record 36 million ETH is now locked in staking, roughly 29–30% of the circulating supply, and the va...

Ethereum Futures Just Hit A Binance Record: Are Traders Calling The Bottom?
Ethereum derivatives activity is flashing a fresh signal on Binance, where open interest measured in ETH terms has reached a new a...

Kraken Becomes Official Crypto Exchange Supporter Of FIFA World Cup 2026
TL;DR Kraken says it has become the Official Crypto Exchange Supporter of the FIFA World Cup 2026. The tournament expands to 48 te...

Most Traders Will Scroll Past This Grok AI Bitcoin Predicts, Big Mistake
Elon Musk Grok AI just looked at a Bitcoin chart down more than 50% and predicts it’s a classic accumulation zone, targeting $150,...