Ethereum Price Slippery Slope: More Downside Risks in Sight
Ethereum price failed to clear the $3,650 resistance. ETH declined again after the Fed decision and now shows bearish signs below the $3,550 level. Ethereum started a fresh decline below the $3,580 support zone. The pric...

Ethereum price failed to clear the $3,650 resistance. ETH declined again after the Fed decision and now shows bearish signs below the $3,550 level.
- Ethereum started a fresh decline below the $3,580 support zone.
- The price is trading below $3,550 and the 100-hourly Simple Moving Average.
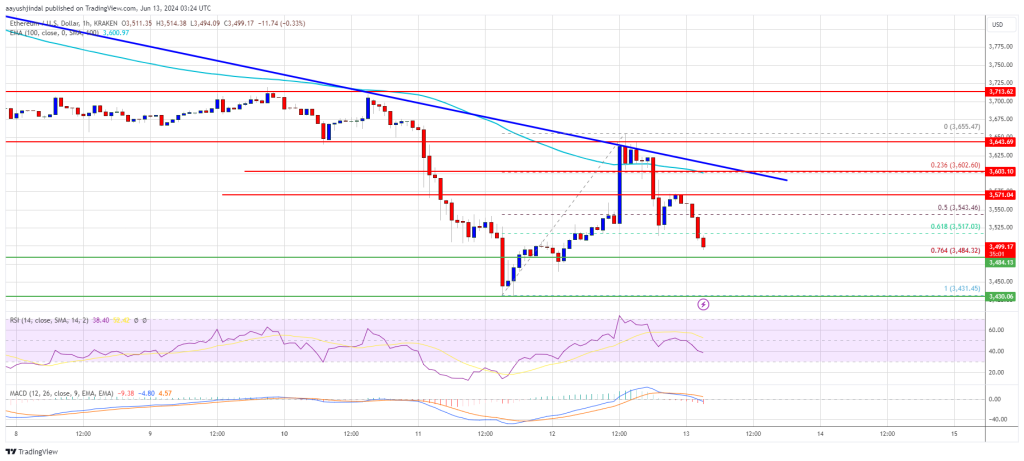
- There is a major bearish trend line forming with resistance near $3,610 on the hourly chart of ETH/USD (data feed via Kraken).
- The pair could extend losses if it stays below the $3,600 resistance zone.
Ethereum price attempted a recovery wave above the $3,550 and $3,580 resistance levels. However, ETH failed to settle above the $3,650 level and started another decline. There was a steady decline below the $3,580 level, like Bitcoin.
The price declined below the $3,550 support level. There was a move below the 61.8% Fib retracement level of the upward move from the $3,431 swing low to the $3,655 high.
Ethereum is now trading below $3,550 and the 100-hourly Simple Moving Average. There is also a major bearish trend line forming with resistance near $3,610 on the hourly chart of ETH/USD. If there is a fresh increase, the price might face resistance near the $3,580 level.
The first major resistance is near the $3,600 level and the trend line. An upside break above the $3,600 resistance might send the price higher. The next key resistance sits at $3,650, above which the price might gain traction and rise toward the $3,720 level.
A clear move above the $3,720 level might call for a test of the $3,800 resistance. Any more gains could send Ether toward the $3,880 resistance zone.
More Downsides In ETH?If Ethereum fails to clear the $3,600 resistance, it could continue to move down. Initial support on the downside is near $3,480 and the 76.4% Fib retracement level of the upward move from the $3,431 swing low to the $3,655 high. The next major support is near the $3,420 zone.
A clear move below the $3,420 support might push the price toward $3,320. Any more losses might send the price toward the $3,250 level in the near term.
Technical Indicators
Hourly MACD – The MACD for ETH/USD is gaining momentum in the bearish zone.
Hourly RSI – The RSI for ETH/USD is now below the 50 zone.
Major Support Level – $3,420
Major Resistance Level – $3,600
Original source
Read on NewsBTCRelated market context

Standard Chartered Says Bitcoin Bottomed Near $59,000 As Crypto Winter Ends
TL;DR Standard Chartered’s Geoffrey Kendrick reportedly says Bitcoin’s $59,000 area marked the cycle bottom. The note cites SpaceX...

Google Gemini AI Predicts Jaw-Dropping XRP Price For Next 90 Days
Google Gemini AI just put XRP back under the spotlight, predicting it is tightly wound for a major breakout toward $1.60 to $1.80...

Bitcoin price challenges $64,000 weekend wall – needing a breakout or risk a deeper correction
Bitcoin reclaimed $64,000 on June 12 and touched an intraday high of $64,301 in the same session that spot ETF flows finally flipp...

Elon Musk SpaceX AI Predicts Incredible Bitcoin Price For Next 30 Days
Here is the thing about capitulation calls. They only sound smart in hindsight. Right now, with Bitcoin price scraping along the l...

Michael Saylor says investor confidence in Ethereum has collapsed
Ethereum's declining investor confidence signals a shift towards Bitcoin dominance, emphasizing real-world utility over speculativ...

Blackrock’s IBIT Leads $86 Million Bitcoin ETF Inflow as Ethereum Funds Extend Outflow Streak
Spot bitcoin exchange-traded funds (ETFs) drew $85.85 million in net inflows on Friday, with every one of the 12 tracked funds avo...