Ethereum Price Struggles Near Highs — Reversal Risk Rising
Ethereum price started a recovery wave above the $2,020 zone. ETH is now struggling to clear $2,080 and remains at risk of another decline in the near term. Ethereum started a recovery wave above the $2,020 zone. The pri...

Ethereum price started a recovery wave above the $2,020 zone. ETH is now struggling to clear $2,080 and remains at risk of another decline in the near term.
- Ethereum started a recovery wave above the $2,020 zone.
- The price is trading above $2,020 and the 100-hourly Simple Moving Average.
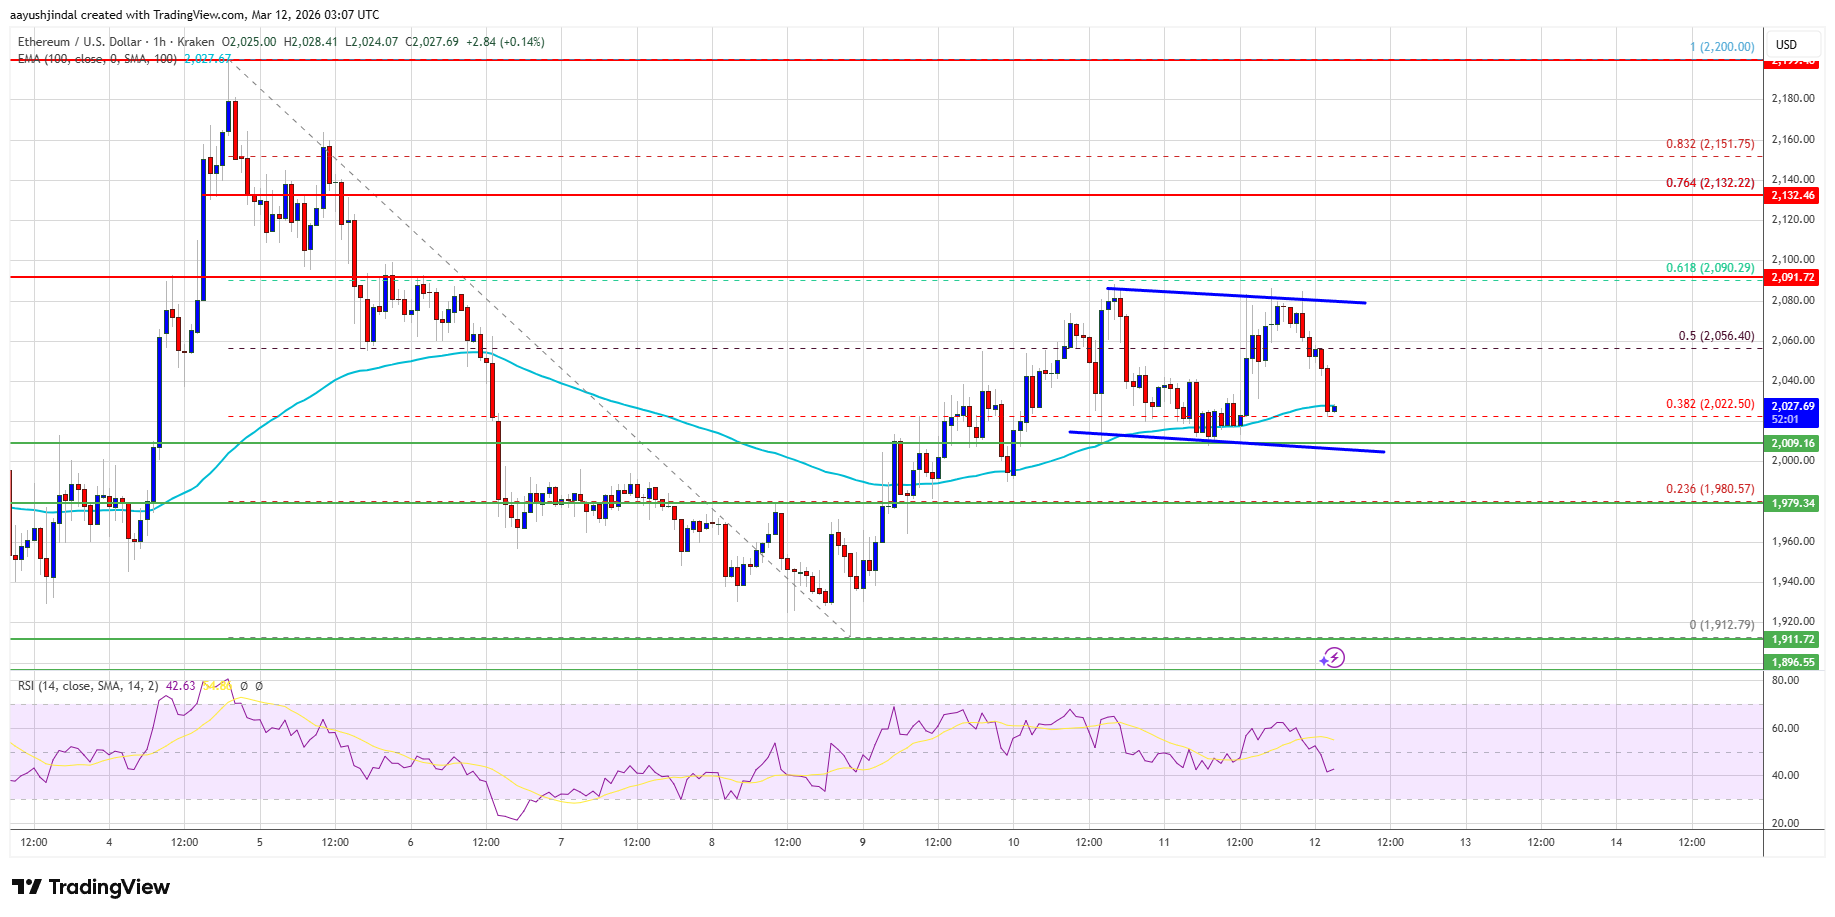
- There is a declining channel forming with support at $2,000 on the hourly chart of ETH/USD (data feed via Kraken).
- The pair could start a fresh decline if it stays below the $2,080 zone.
Ethereum price extended its recovery wave after it cleared the $1,965 zone, like Bitcoin. ETH price was able to clear the $2,000 resistance zone.
The bulls pushed the price above the 50% Fib retracement level of the downward move from the $2,200 swing high to the $1,912 low. The price even spiked above $2,050 but faced sellers near $2,090. The bears protected more gains and pushed the price below $2,050.
Ethereum price is now trading above $2,000 and the 100-hourly Simple Moving Average. There is also a declining channel forming with support at $2,000 on the hourly chart of ETH/USD.
If the bulls remain in action above $2,000, the price could attempt another increase. Immediate resistance is seen near the $2,055 level. The first key resistance is near the $2,080 level or the 61.8% Fib retracement level of the downward move from the $2,200 swing high to the $1,912 low.
The next major resistance is near the $2,135 level. A clear move above the $2,135 resistance might send the price toward the $2,150 resistance. An upside break above the $2,150 region might call for more gains in the coming days. In the stated case, Ether could rise toward the $2,200 resistance zone or even $2,220 in the near term.
Downside Continuation In ETH?If Ethereum fails to clear the $2,050 resistance, it could start a fresh decline. Initial support on the downside is near the $2,000 level. The first major support sits near the $1,980 zone.
A clear move below the $1,980 support might push the price toward the $1,910 support. Any more losses might send the price toward the $1,880 region. The main support could be $1,840.
Technical Indicators
Hourly MACD – The MACD for ETH/USD is gaining momentum in the bearish zone.
Hourly RSI – The RSI for ETH/USD is now below the 50 zone.
Major Support Level – $1,980
Major Resistance Level – $2,080
Original source
Read on NewsBTCRelated market context

XRP Price Prediction: Japan XRP ETF Listing is Getting Closer
Japan just handed XRP bulls a major regulatory tailwind. XRP price is retesting a congestion zone, and the prediction could turn b...

Kraken Becomes Official Crypto Exchange Supporter Of FIFA World Cup 2026
TL;DR Kraken says it has become the Official Crypto Exchange Supporter of the FIFA World Cup 2026. The tournament expands to 48 te...

Ethereum Price Prediction: 3 Million ETH Rushes Into Staking as Sellers Vanish
Is nobody leaving Ethereum? A record 36 million ETH is now locked in staking, roughly 29–30% of the circulating supply, and the va...

XRP Price Prediction: Japan Regulates Crypto like Stocks, XRP to Benefit First
Japan just rewrote the rules. XRP price is battling below resistance at $1.10, but it’s prediction is getting bullish as Japan’s p...

Most Traders Will Scroll Past This Grok AI Bitcoin Predicts, Big Mistake
Elon Musk Grok AI just looked at a Bitcoin chart down more than 50% and predicts it’s a classic accumulation zone, targeting $150,...

Ripple chases AI’s machine economy as XRPL stablecoins near $1 billion
Stablecoin liquidity on the XRP Ledger (XRPL) has nearly doubled over the past month, putting the network within reach of a $1 bil...