Ethereum Price Struggles to Recover: Short-Term Outlook Weak
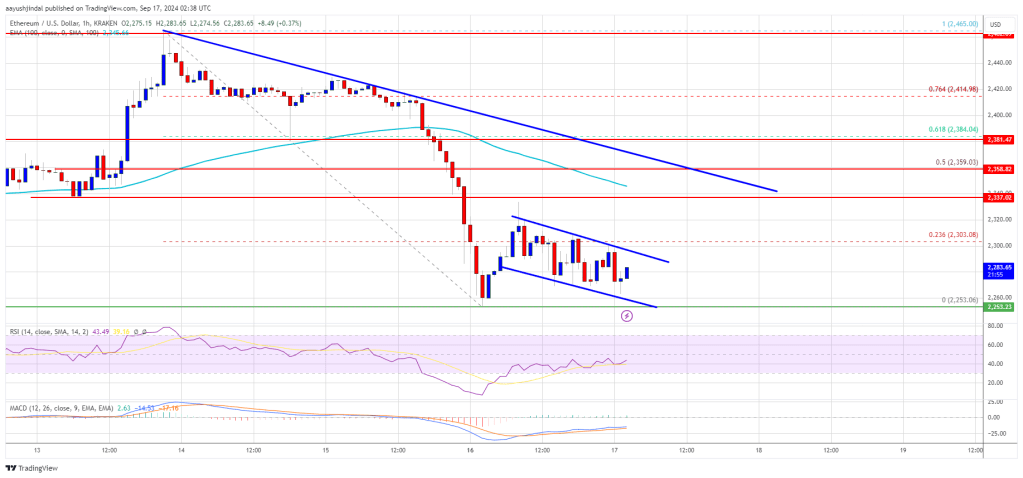
Ethereum price gained bearish momentum and traded below $2,350. ETH is consolidating losses and might struggle to recover above $2,350. Ethereum started another decline below $2,350 and $2,320. The price is trading below...

Ethereum price gained bearish momentum and traded below $2,350. ETH is consolidating losses and might struggle to recover above $2,350.
- Ethereum started another decline below $2,350 and $2,320.
- The price is trading below $2,310 and the 100-hourly Simple Moving Average.
- There is a major bearish trend line forming with resistance at $2,360 on the hourly chart of ETH/USD (data feed via Kraken).
- The pair must clear the $2,360 resistance to start a recovery wave in the near term.
Ethereum price failed to clear the $2,450 resistance and started another decline like Bitcoin. ETH traded below the $2,400 and $2,350 support levels to enter a bearish zone.
The price even dived below the $2,320 level. A low was formed at $2,253 and the price is now consolidating losses. There was a minor recovery wave above the $2,285 level. The price tested the 23.6% Fib retracement level of the downward wave from the $2,466 swing high to the $2,253 low.
Ethereum price is now trading below $2,310 and the 100-hourly Simple Moving Average. On the upside, the price seems to be facing hurdles near the $2,300 level. There is also a declining channel forming with resistance at $2,300 on the hourly chart of ETH/USD.
The first major resistance is near the $2,340 level. The next key resistance is near $2,360 or the 50% Fib retracement level of the downward wave from the $2,466 swing high to the $2,253 low. There is also a major bearish trend line forming with resistance at $2,360 on the same chart.
An upside break above the $2,360 resistance might call for more gains. In the stated case, Ether could rise toward the $2,420 resistance zone in the near term. The next hurdle sits near the $2,465 level.
More Losses In ETH?If Ethereum fails to clear the $2,360 resistance, it could start another decline in the near term. Initial support on the downside is near $2,265. The first major support sits near the $2,250 zone.
A clear move below the $2,250 support might push the price toward $2,200. Any more losses might send the price toward the $2,150 support level in the near term. The next key support sits at $2,120.
Technical Indicators
Hourly MACD – The MACD for ETH/USD is losing momentum in the bearish zone.
Hourly RSI – The RSI for ETH/USD is now below the 50 zone.
Major Support Level – $2,250
Major Resistance Level – $2,300
Original source
Read on NewsBTCRelated market context

Standard Chartered Says Bitcoin Bottomed Near $59,000 As Crypto Winter Ends
TL;DR Standard Chartered’s Geoffrey Kendrick reportedly says Bitcoin’s $59,000 area marked the cycle bottom. The note cites SpaceX...

US forces shoot down Iranian attack drones near Strait of Hormuz, Bitcoin drops below $73K
Geopolitical tensions near vital oil routes can destabilize financial markets, highlighting the interconnectedness of global secur...

XRP aims for $0.90 as ETF demand battles selling pressure from whales
XRP is trading at $1.11, down roughly 17% from its June opening, having set a new 2026 low on June 5 and shed $8 billion in market...

XRP Price Prediction: Japan XRP ETF Listing is Getting Closer
Japan just handed XRP bulls a major regulatory tailwind. XRP price is retesting a congestion zone, and the prediction could turn b...

Elon Musk SpaceX AI Predicts Incredible Bitcoin Price For Next 30 Days
Here is the thing about capitulation calls. They only sound smart in hindsight. Right now, with Bitcoin price scraping along the l...

Bitcoin Mining Cost Model Points To $47,000 Floor, But Analysts Urge Caution
TL;DR Crypto Rover says Bitcoin has never bottomed below electrical production cost, currently estimated at $47,000. Mining-cost m...