ETH’s 2017 Fractal Indicators Are Mirroring Now – The Coin Could Attain a New All-Time High
If history repeats itself, Ethereum (ETH) could reach $13,000 in the next two months, as shown by a fractal indicator from 2017, which contained at least four technical patterns and helped drive the ETH price up by over...
Archive context
Older archive item. Useful for background and entity history, but not a fresh market-moving signal.

If history repeats itself, Ethereum (ETH) could reach $13,000 in the next two months, as shown by a fractal indicator from 2017, which contained at least four technical patterns and helped drive the ETH price up by over 7,000 percent. The same set of bullish pointers has flashed once more in 2021, as ETH trades above $3,350 after a year-to-date gain of over 360 percent.
The 2017 Ethereum Fractal IndicatorsThe four technical indicators are Stochastic RSI, Relative Strength Index (RSI), Bullish Hammer, and a Fibonacci retracement level. The Bullish Hammer appeared on ETH’s monthly chart in December 2017, followed by a 7,000 percent price increase over the next six months.
The massive upward move led by Hammer pushed ETH’s monthly RSI above 94, showing an extremely overbought condition. As a result, the crypto coin began consolidating sideways to counteract its excessively bullish sentiments. As a result, the RSI started to correct lower.
Later, in November 2017, the Stochastic RSI turned bullish, with the percent K line (which measures an asset’s lowest low and highest high to define a price range) crossing above the percent D line (a moving average of the percent K).
Meanwhile, at the time of the change, the Stochastic RSI rendering was above 20, boosting ETH’s bullish continuation hopes. Later on, the Ethereum token increased by 500 percent, closing above $1,200 in January 2018.
This Year’s Fractal RepeatAs it enters Q4 of 2021, ETH is almost echoing the tendencies of the 2017 fractal, but without order. In particular, the token increased by 3,400 percent to over $4,300 sixteen months after a bullish Stochastic RSI cross showed up.
Meanwhile, ETH’s monthly RSI enrolled the overbought zone because of the grand upward move. The bullish similarity also took signals from a potential Stochastic RSI bullish cross and a double top RSI, both of which could appear on ETH’s monthly chart in the following ‘few months,’ just like the one that coincided with the 500 percent price rally in 2018.
The post ETH’s 2017 Fractal Indicators Are Mirroring Now – The Coin Could Attain a New All-Time High first appeared on CryptoGazette - Cryptocurrency News.Why this matters
This ethereum story adds another data point to the current market tape and is useful when read alongside nearby source coverage.
Original source
Read on CryptoGazetteRelated market context

Hyperliquid (HYPE) Price Prediction: $172M Whale Staking and Bullish CVD Divergence Raise Hopes for $73 Retest
HYPE was trading around $57-$59 in the supplied market data, well below its June peak near $76.85. CoinMarketCap currently lists t...

Bitcoin (BTC) Price Prediction: Can BTC Reclaim $64,850 Before the FOMC Meeting Triggers Volatility?
With Bitcoin trading near $64,047, according to the supplied TradingView data, the market is approaching a potentially important t...

Cointelegraph Bitcoin and Ethereum Coverage Reflects Shifting Blockchain Landscape
Cointelegraph's sustained Bitcoin and Ethereum coverage highlights market dynamics, regulatory implications, and the enduring domi...
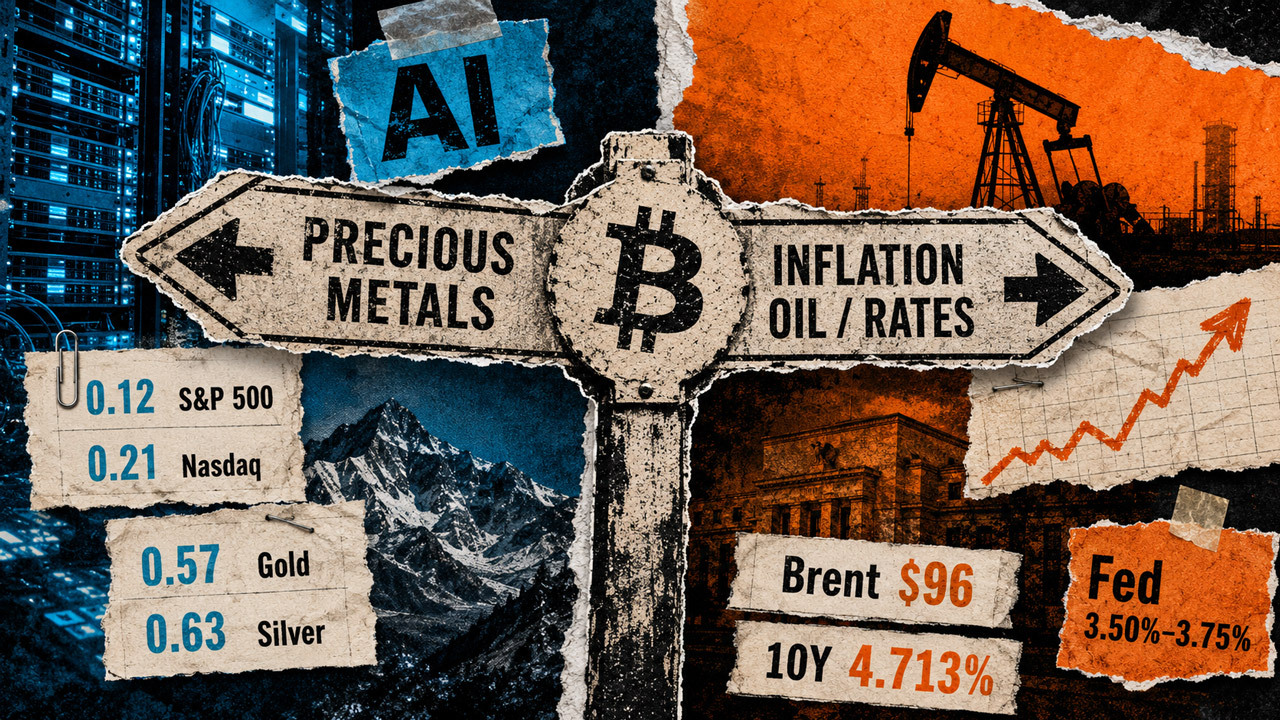
Bitcoin broke away from AI stocks but now $96 oil could turn its escape into a trap
Bitcoin's daily correlation with the S&P 500 fell to 0.12 during the second quarter, down from 0.58 in the fourth quarter of 2025,...

Bitcoin Miners Are Becoming AI Landlords. But Which Leases Are a Positive Investment Signal?
The best story in bitcoin mining hasn’t had anything to do with bitcoin in a long time. Years ago, this business (which long lived...

Strategy now publishes the Bitcoin return threshold below which it may have to restructure
Strategy’s newly published metric shows Bitcoin could decline at a constant annual rate of 11.34% across the weighted duration of...