TA: Ethereum Dips From Highs, Why ETH Could Correct To $1,375
Ethereum started a downside correction from $1,630 against the US Dollar. ETH could extend losses if there is a clear move below the $1,480 support. Ethereum started a downside correction from the $1,630 resistance zone....

Ethereum started a downside correction from $1,630 against the US Dollar. ETH could extend losses if there is a clear move below the $1,480 support.
- Ethereum started a downside correction from the $1,630 resistance zone.
- The price is now trading below $1,500 and near the 100 hourly simple moving average.
- There is a key bullish trend line forming with support near $1,480 on the hourly chart of ETH/USD (data feed via Kraken).
- The pair could extend its downside correction if it breaks the $1,480 support.
Ethereum attempted another increase above the $1,600 resistance zone. However, ETH failed to gain pace above the $1,600 level. As a result, there was a downside correction below the $1,550 level.
Ether price corrected lower below the $1,520 support. There was a break below the 23.6% Fib retracement level of the key increase from the $1,325 swing low to $1,632 high. The price is now trading below $1,500 and near the 100 hourly simple moving average.
It is now approaching the key $1,480 support zone. There is also a key bullish trend line forming with support near $1,480 on the hourly chart of ETH/USD.
An immediate resistance on the upside is near the $1,520 level. The first major resistance is near the $1,560 zone. The main breakout zone is now forming near the $1,600 zone. A clear move above the $1,600 level could start another major increase.
Source: ETHUSD on TradingView.com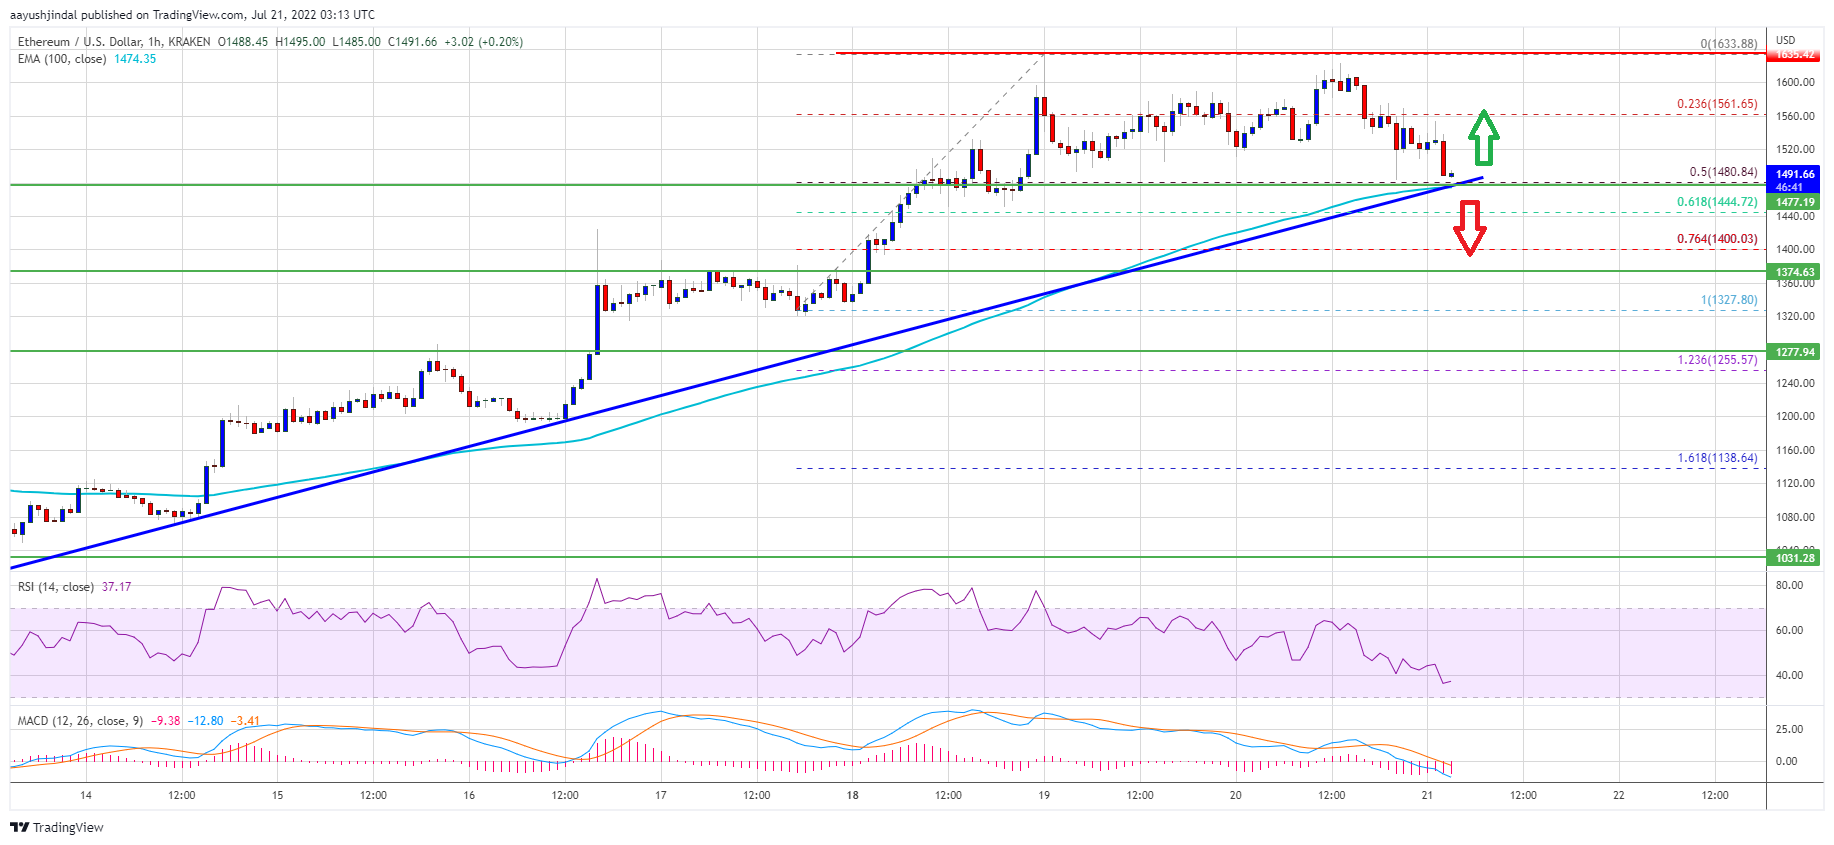
The next key barrier is near the $1,630 level, above which the price might gain strength and rise towards the $1,700 resistance zone.
More Losses in ETH?If ethereum fails to rise above the $1,560 resistance, it could continue to move down. An initial support on the downside is near the $1,480 zone and the trend line.
The trend line is near the 50% Fib retracement level of the key increase from the $1,325 swing low to $1,632 high. A clear move below the trend line support might push the price towards the $1,375 support zone. Any more losses might even push ether price below the $1,280 support.
Technical Indicators
Hourly MACD – The MACD for ETH/USD is now gaining momentum in the bearish zone.
Hourly RSI – The RSI for ETH/USD is now below the 50 level.
Major Support Level – $1,480
Major Resistance Level – $1,560
Original source
Read on NewsBTCRelated market context

Ethereum Price Prediction: 3 Million ETH Rushes Into Staking as Sellers Vanish
Is nobody leaving Ethereum? A record 36 million ETH is now locked in staking, roughly 29–30% of the circulating supply, and the va...

Standard Chartered Says Bitcoin Bottomed Near $59,000 As Crypto Winter Ends
TL;DR Standard Chartered’s Geoffrey Kendrick reportedly says Bitcoin’s $59,000 area marked the cycle bottom. The note cites SpaceX...

Elon Musk SpaceX AI Predicts Incredible Bitcoin Price For Next 30 Days
Here is the thing about capitulation calls. They only sound smart in hindsight. Right now, with Bitcoin price scraping along the l...

Michael Saylor says investor confidence in Ethereum has collapsed
Ethereum's declining investor confidence signals a shift towards Bitcoin dominance, emphasizing real-world utility over speculativ...

Blackrock’s IBIT Leads $86 Million Bitcoin ETF Inflow as Ethereum Funds Extend Outflow Streak
Spot bitcoin exchange-traded funds (ETFs) drew $85.85 million in net inflows on Friday, with every one of the 12 tracked funds avo...

Ethereum Foundation’s Kohaku proposes post-quantum account protection for $0.07
Kohaku's opt-in quantum protection could accelerate Ethereum's security evolution, influencing investor confidence and market dyna...