TA: Ethereum Loses Steam, Why 100 SMA Is The Key For More Gains
Ethereum was able to clear the $1,700 resistance against the US Dollar. ETH failed to stay above $1,700 and is currently struggling to continue higher. Ethereum was able to slowly move higher above $1,650 and $1,700. The...

Ethereum was able to clear the $1,700 resistance against the US Dollar. ETH failed to stay above $1,700 and is currently struggling to continue higher.
- Ethereum was able to slowly move higher above $1,650 and $1,700.
- The price is now trading above $1,655 and the 100 hourly simple moving average.
- There is a crucial rising channel forming with support near $1,670 on the hourly chart of ETH/USD (data feed via Kraken).
- The pair could continue to move up if it stays above the $1,655 support zone.
Ethereum started an upside correction above the $1,650 resistance zone. ETH climbed above the $1,660 and $1,675 levels to move into a short-term positive zone.
There was a spike above the $1,700 level and a close above the 100 hourly simple moving average. Ether price even moved a few points above the 50% Fib retracement level of the key decline from the $1,880 swing high to $1,525 low.
However, the bulls failed to stay above the $1,700 resistance zone. It is now moving lower below $1,680. There is also a crucial rising channel forming with support near $1,670 on the hourly chart of ETH/USD.
An immediate resistance on the upside is near the $1,700 level. The first major resistance is now forming near the $1,720 level. The next major resistance is near the $1,745 level. It is near the 61.8% Fib retracement level of the key decline from the $1,880 swing high to $1,525 low.
Source: ETHUSD on TradingView.com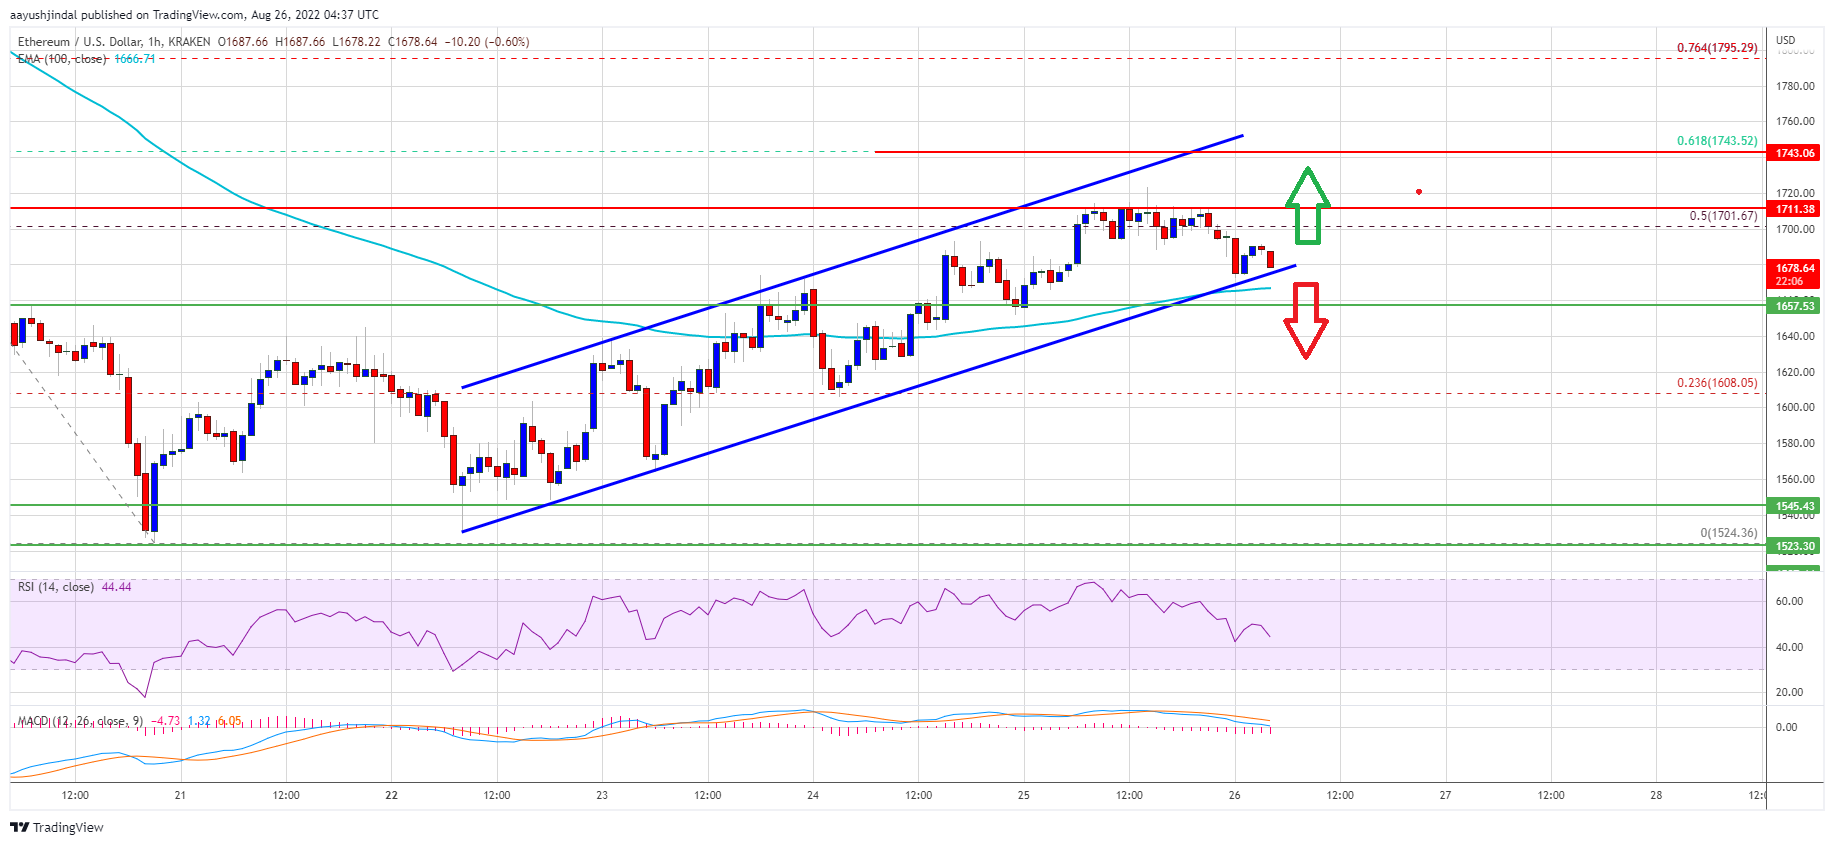
A clear move above the $1,745 level might send the price towards $1,800 resistance. Any more gains may perhaps open the doors for a test of the $1,850 resistance.
Fresh Decline in ETH?If ethereum fails to rise above the $1,720 resistance, it could start a fresh decline. An initial support on the downside is near the $1,670 zone and the channel trend line.
The next major support is near $1,655 and the 100 hourly simple moving average, below which ether price might accelerate lower. In the stated case, the price may perhaps decline towards the $1,600 level. Any more losses may perhaps send the price towards the $1,550 level.
Technical Indicators
Hourly MACD – The MACD for ETH/USD is now losing momentum in the bullish zone.
Hourly RSI – The RSI for ETH/USD is now below the 50 level.
Major Support Level – $1,655
Major Resistance Level – $1,720
Original source
Read on NewsBTCRelated market context

Standard Chartered Says Bitcoin Bottomed Near $59,000 As Crypto Winter Ends
TL;DR Standard Chartered’s Geoffrey Kendrick reportedly says Bitcoin’s $59,000 area marked the cycle bottom. The note cites SpaceX...

Google Gemini AI Predicts Jaw-Dropping XRP Price For Next 90 Days
Google Gemini AI just put XRP back under the spotlight, predicting it is tightly wound for a major breakout toward $1.60 to $1.80...

Bitcoin price challenges $64,000 weekend wall – needing a breakout or risk a deeper correction
Bitcoin reclaimed $64,000 on June 12 and touched an intraday high of $64,301 in the same session that spot ETF flows finally flipp...

Bitcoin rises above $64,000 after Pakistan prime minister says Iran peace deal is near
Bitcoin traded above $64,000 on Saturday, supported by its strongest ETF inflows in a month and growing optimism around geopolitic...

Bitcoin price faces new risk as big buyers lose conviction
Bitcoin’s largest buyers are no longer behaving like a reliable backstop for the largest cryptocurrency. The exchange-traded funds...

Elon Musk SpaceX AI Predicts Incredible Bitcoin Price For Next 30 Days
Here is the thing about capitulation calls. They only sound smart in hindsight. Right now, with Bitcoin price scraping along the l...