TA: Ethereum Prints Bullish Pattern, Why ETH Could Surge Past $1,800
Ethereum corrected lower below $1,750 against the US Dollar. ETH remained well bid above $1,680 and is eyeing a fresh surge above $1,750. Ethereum is trading in a bullish zone above the $1,680 and $1,700 levels. The pric...

Ethereum corrected lower below $1,750 against the US Dollar. ETH remained well bid above $1,680 and is eyeing a fresh surge above $1,750.
- Ethereum is trading in a bullish zone above the $1,680 and $1,700 levels.
- The price is now trading near $1,720 and the 100 hourly simple moving average.
- There is a key bullish flag pattern forming with resistance near $1,730 on the hourly chart of ETH/USD (data feed via Kraken).
- The pair must clear $1,750 to continue higher towards $1,850 in the near term.
Ethereum gained pace above the $1,700 and $1,720 levels. ETH even cleared the $1,750 level, but there was no test of the $1,800 resistance zone. A high was formed near $1,788 before the price started a downside correction.
There was a move below the $1,750 level and the 100 hourly simple moving average. The price dipped below the 23.6% Fib retracement level of the upward move from the $1,490 swing low to $1,788 high. Ether price even dipped below the $1,700 level.
However, the bulls were active near the $1,680 level. The price is now rising and trading above $1,700. It is trading near $1,720 and the 100 hourly simple moving average.
On the upside, the price is facing resistance near the $1,730 level. There is also a key bullish flag pattern forming with resistance near $1,730 on the hourly chart of ETH/USD. The next major resistance is near the $1,750 level. A clear break above $1,750 might send the price towards the $1,780 level.
Source: ETHUSD on TradingView.com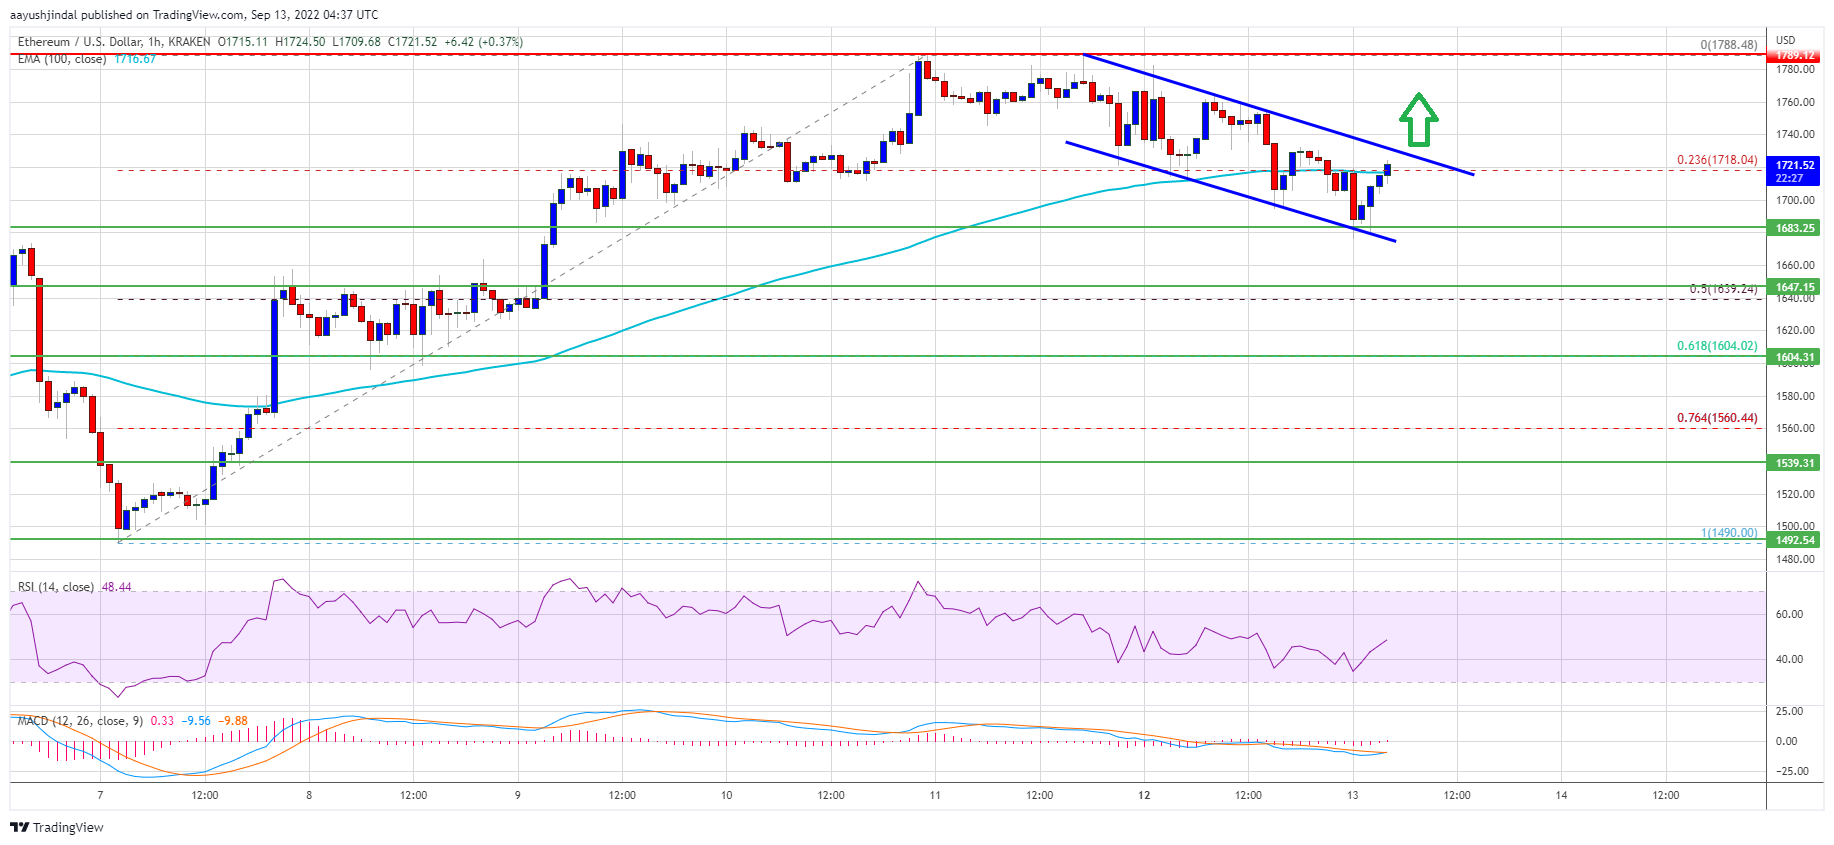
Any more gains may perhaps open the doors for a move towards the $1,850 resistance in the near term. If the bulls remain in action, the price could pump towards the $1,880 level.
Dips Limited in ETH?If ethereum fails to rise above the $1,750 resistance, it could start a downside correction. An initial support on the downside is near the $1,680 zone.
The next major support is near $1,650. It is near the 50% Fib retracement level of the upward move from the $1,490 swing low to $1,788 high. A downside break below the $1,650 support might spark more losses. In the stated case, ether price might drop towards the $1,600 level.
Technical Indicators
Hourly MACD – The MACD for ETH/USD is now gaining momentum in the bullish zone.
Hourly RSI – The RSI for ETH/USD is now above the 50 level.
Major Support Level – $1,680
Major Resistance Level – $1,750
Original source
Read on NewsBTCRelated market context

Standard Chartered Says Bitcoin Bottomed Near $59,000 As Crypto Winter Ends
TL;DR Standard Chartered’s Geoffrey Kendrick reportedly says Bitcoin’s $59,000 area marked the cycle bottom. The note cites SpaceX...

Michael Saylor says investor confidence in Ethereum has collapsed
Ethereum's declining investor confidence signals a shift towards Bitcoin dominance, emphasizing real-world utility over speculativ...

XRP aims for $0.90 as ETF demand battles selling pressure from whales
XRP is trading at $1.11, down roughly 17% from its June opening, having set a new 2026 low on June 5 and shed $8 billion in market...

XRP Price Prediction: Japan XRP ETF Listing is Getting Closer
Japan just handed XRP bulls a major regulatory tailwind. XRP price is retesting a congestion zone, and the prediction could turn b...

Blackrock’s IBIT Leads $86 Million Bitcoin ETF Inflow as Ethereum Funds Extend Outflow Streak
Spot bitcoin exchange-traded funds (ETFs) drew $85.85 million in net inflows on Friday, with every one of the 12 tracked funds avo...

Ethereum Foundation’s Kohaku proposes post-quantum account protection for $0.07
Kohaku's opt-in quantum protection could accelerate Ethereum's security evolution, influencing investor confidence and market dyna...