TA: Ethereum Stuck In Key Range, Why $1,480 Is The Key
Ethereum failed again to settle above the $1,620 zone against the US Dollar. ETH is sliding and might struggle to stay above the $1,480 support. Ethereum started another decline after there was a false break above $1,620...

Ethereum failed again to settle above the $1,620 zone against the US Dollar. ETH is sliding and might struggle to stay above the $1,480 support.
- Ethereum started another decline after there was a false break above $1,620.
- The price is now trading below $1,560 and the 100 hourly simple moving average.
- There is a key bullish trend line forming with support near $1,500 on the hourly chart of ETH/USD (data feed via Kraken).
- The pair could start a fresh increase unless there is a clear move below the $1,480 support.
Ethereum made another attempt to clear the $1,620 resistance zone. ETH even spiked above the $1,640 and $1,650 levels. However, the bears were active near the $1,660 level.
A high was formed near $1,662 and the price started a fresh decline. There was a downside break below the $1,560 and $1,550 levels. Ether price declined below the 50% Fib retracement level of the upward move from the $1,488 swing low to $1,662 high.
The price is now trading below $1,560 and the 100 hourly simple moving average. It is also trading below the 76.4% Fib retracement level of the upward move from the $1,488 swing low to $1,662 high.
However, it is still above the $1,500 support. Besides, there is a key bullish trend line forming with support near $1,500 on the hourly chart of ETH/USD. An immediate resistance on the upside is near the $1,530 level. The first major resistance is near the $1,550 zone and the 100 hourly simple moving average.
Source: ETHUSD on TradingView.com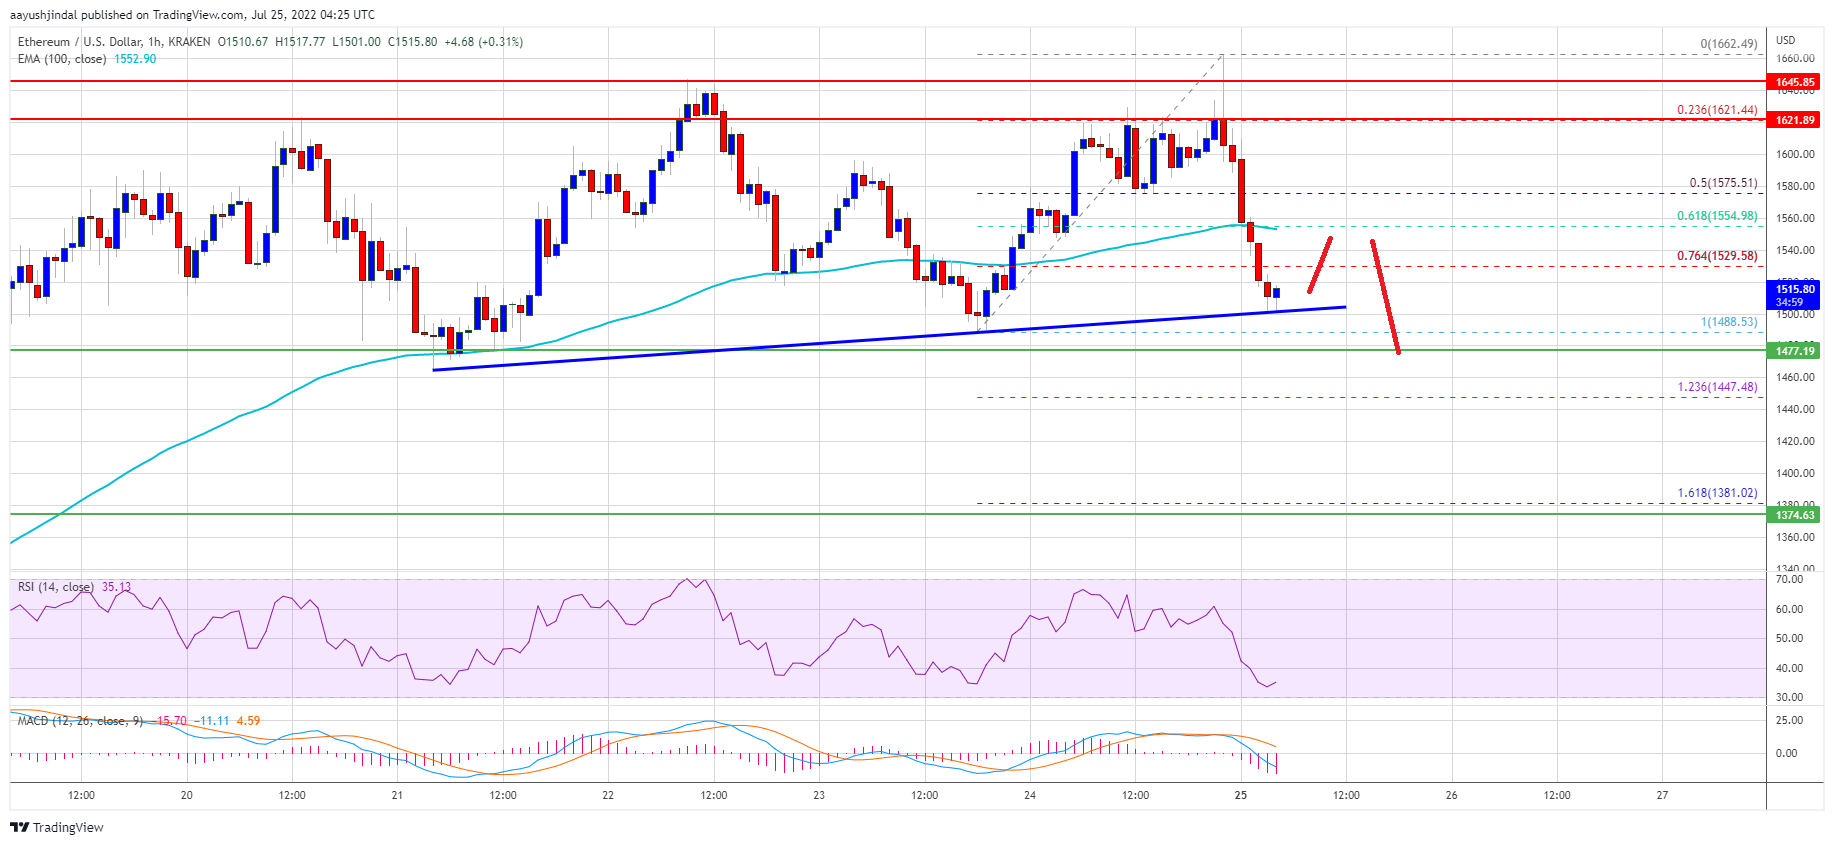
The main breakout zone is now forming near the $1,620 zone. A clear move above the $1,620 level could start a decent increase. The next key barrier is near the $1,660 level, above which the price might rise towards the $1,700 resistance zone.
More Losses in ETH?If ethereum fails to rise above the $1,550 resistance, it could continue to move down. An initial support on the downside is near the $1,500 zone and the trend line.
A clear move below the trend line support might push the price towards the $1,480 support zone. Any more losses might even push ether price to the $1,400 support.
Technical Indicators
Hourly MACD – The MACD for ETH/USD is now losing momentum in the bullish zone.
Hourly RSI – The RSI for ETH/USD is now below the 50 level.
Major Support Level – $1,480
Major Resistance Level – $1,550
Original source
Read on NewsBTCRelated market context

Standard Chartered Says Bitcoin Bottomed Near $59,000 As Crypto Winter Ends
TL;DR Standard Chartered’s Geoffrey Kendrick reportedly says Bitcoin’s $59,000 area marked the cycle bottom. The note cites SpaceX...

Elon Musk SpaceX AI Predicts Incredible Bitcoin Price For Next 30 Days
Here is the thing about capitulation calls. They only sound smart in hindsight. Right now, with Bitcoin price scraping along the l...

XRP Price Prediction: Japan XRP ETF Listing is Getting Closer
Japan just handed XRP bulls a major regulatory tailwind. XRP price is retesting a congestion zone, and the prediction could turn b...

Google Gemini AI Predicts Jaw-Dropping XRP Price For Next 90 Days
Google Gemini AI just put XRP back under the spotlight, predicting it is tightly wound for a major breakout toward $1.60 to $1.80...

Bitcoin price challenges $64,000 weekend wall – needing a breakout or risk a deeper correction
Bitcoin reclaimed $64,000 on June 12 and touched an intraday high of $64,301 in the same session that spot ETF flows finally flipp...

Michael Saylor says investor confidence in Ethereum has collapsed
Ethereum's declining investor confidence signals a shift towards Bitcoin dominance, emphasizing real-world utility over speculativ...