Dogwifhat Struggles Near 0.90, But Strong Market Attention Signals Room For Recovery
On the weekly chart, the asset continues to form higher lows and a rounded bottom, a technical pattern often tied to accumulation phases and bullish continuation. Analyst n𝖎𝖓𝖏𝖆 highlights that if momentum returns across...
Archive context
Older archive item. Useful for background and entity history, but not a fresh market-moving signal.

On the weekly chart, the asset continues to form higher lows and a rounded bottom, a technical pattern often tied to accumulation phases and bullish continuation.
Analyst n𝖎𝖓𝖏𝖆 highlights that if momentum returns across major meme tokens, Dogwifhat could target the $2.8 level, representing a potential 3x move from its current range. This outlook positions the token for renewed activity should sentiment strengthen within the broader meme market.
Analyst Ampera further notes that while Dogwifhat trades below $1, Google trend interest remains high at 89 out of 100, close to its March 2024 peak when the price hit $4.85. This signals strong community engagement and sustained demand despite retracement. The intraday swings near $0.90 show strong market interest, hinting at a breakout if meme coin momentum returns.
Technical Structure and Market PatternsAnalyst n𝖎𝖓𝖏𝖆 observed that Dogwifhat has maintained resilience despite recent weakness across meme coins. On the weekly chart, the token continues to establish higher lows, suggesting consistent buying activity at stronger levels. This gradual build-up has shaped a rounded bottom formation, a pattern often linked to accumulation and potential upward continuation.
WIFUSD Chart | Source:x
The analyst outlined a target near $2.8, representing a possible threefold move from the current range when measured against SOL. According to the projection, holding positions during the consolidation phase could provide traders with favorable entry conditions before another upward attempt. The outlook remains dependent on the broader meme coin sector regaining momentum.
Market Sentiment and Resistance LevelsThe analysis further indicates that its structural support lies within its higher-low formation, reinforcing the view of stability during consolidation. Should sentiment improve across meme tokens, the projected path positions the asset to challenge resistance near $2.8. However, any move toward this level is tied to sustained activity in the sector.
The present market environment has left it oscillating near the $0.90 threshold, a level acting as a psychological marker for both buyers and sellers. Maintaining this support is crucial, as failure could trigger further retracements, while stability here may strengthen the possibility of renewed growth.
Google Trends and Investor AttentionAnalyst Ampera provided additional insights by comparing market attention with price levels. The cryptocurrency reached peak Google trend interest in March 2024 with a score of 100, aligning with its all-time high of $4.85. This alignment illustrated how investor participation mirrored price performance at the peak of enthusiasm.
WIFUSD Chart | Source:x
Current data shows trend interest remains elevated at 89 out of 100, despite the asset trading under $1. This suggests demand and visibility within the community remain strong even as price retraces. Elevated attention levels during a downturn often indicate that broader interest has not faded, creating conditions where price may eventually respond if sentiment strengthens.
Intraday Volatility and Trading ActivityRecent 24-hour trading data shows the token opened near $0.91, dipped below $0.885 in early sessions, and briefly rebounded toward $0.91. The recovery proved short-lived, with sellers regaining control and pushing the price to settle at $0.89, a 3.37% loss within the period. This movement reflects notable volatility as buyers and sellers compete for control near key levels.
WIFUSD 24-Hr Chart | Source: BraveNewCoin
Daily trading volume remained stable around $183.7 million, suggesting active market engagement despite the downward drift. The inability to sustain momentum above $0.90 emphasizes the current struggle between short-term buyers seeking to establish support and sellers pressing at resistance. For now, the structure indicates a tightly contested market where price remains sensitive to changes in sentiment across meme tokens.
Why this matters
This research story adds another data point to the current market tape and is useful when read alongside nearby source coverage.
Original source
Read on Brave New CoinRelated market context

XRP Price Prediction: Ripple’s $700M Escrow Return Puts $1.59 Resistance in the Spotlight
The setup comes shortly after Ripple returned 700 million XRP, worth more than $1 billion, to escrow following its scheduled Octob...

Bitcoin (BTC) Price Today: 2028 Halving Cycle and BlackRock ETF Inflow Signal Long-Term Rally
Recent market data also show that Bitcoin buyers have absorbed a key sell wall around $85,000, reducing one source of near-term re...

XRP Price Prediction: Ripple Teases Special Announcement in Korea Blockchain Week
XRP price is hovering at $1.52 on October 2, up 1% over 24 hours, as we look toward Ripple’s October 3 appearance in Seoul, which...

XRP Price, $300M ETF Demand, and 45% Q3 Supply Overhang
XRP price rose more than 45% in Q3 as U.S. spot XRP ETFs attracted about $307.9 million, yet the token entered October near $1.50...

Chainlink And Swift Demo Automated Tokenized-Equity Dividends Across Four Blockchains
TL;DR Chainlink built a Swift Hackathon solution that automated a cash-dividend workflow for tokenized equities across four blockc...
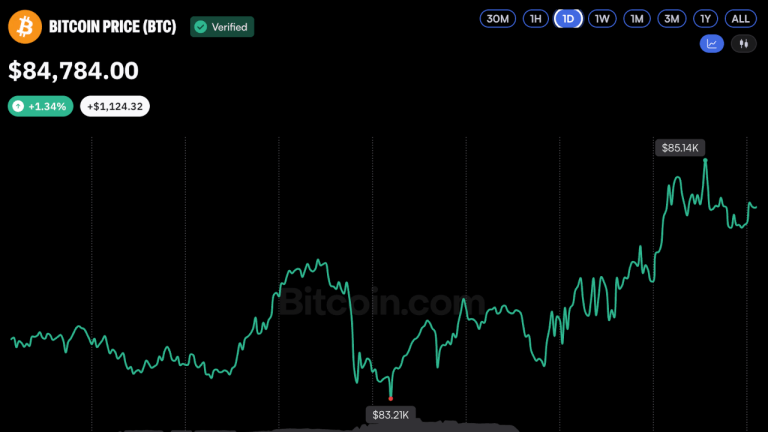
Bitcoin Price Enters October Near $85K—Now $95K Is Back in Play
Bitcoin closed September at $83,563, above several closely watched onchain and technical levels as October begins with a historica...