Early Signs of a Crack in the Back of the Nasdaq 100 Index Rally?
At the risk of being labeled the boy that cried wolf, there are early signs of a crack in the back of the NASDAQ 100 Index’s rally. These include a violation of the Lower Warning Line (dashed red line, LWL) of the Standa...
Archive context
Older archive item. Useful for background and entity history, but not a fresh market-moving signal.
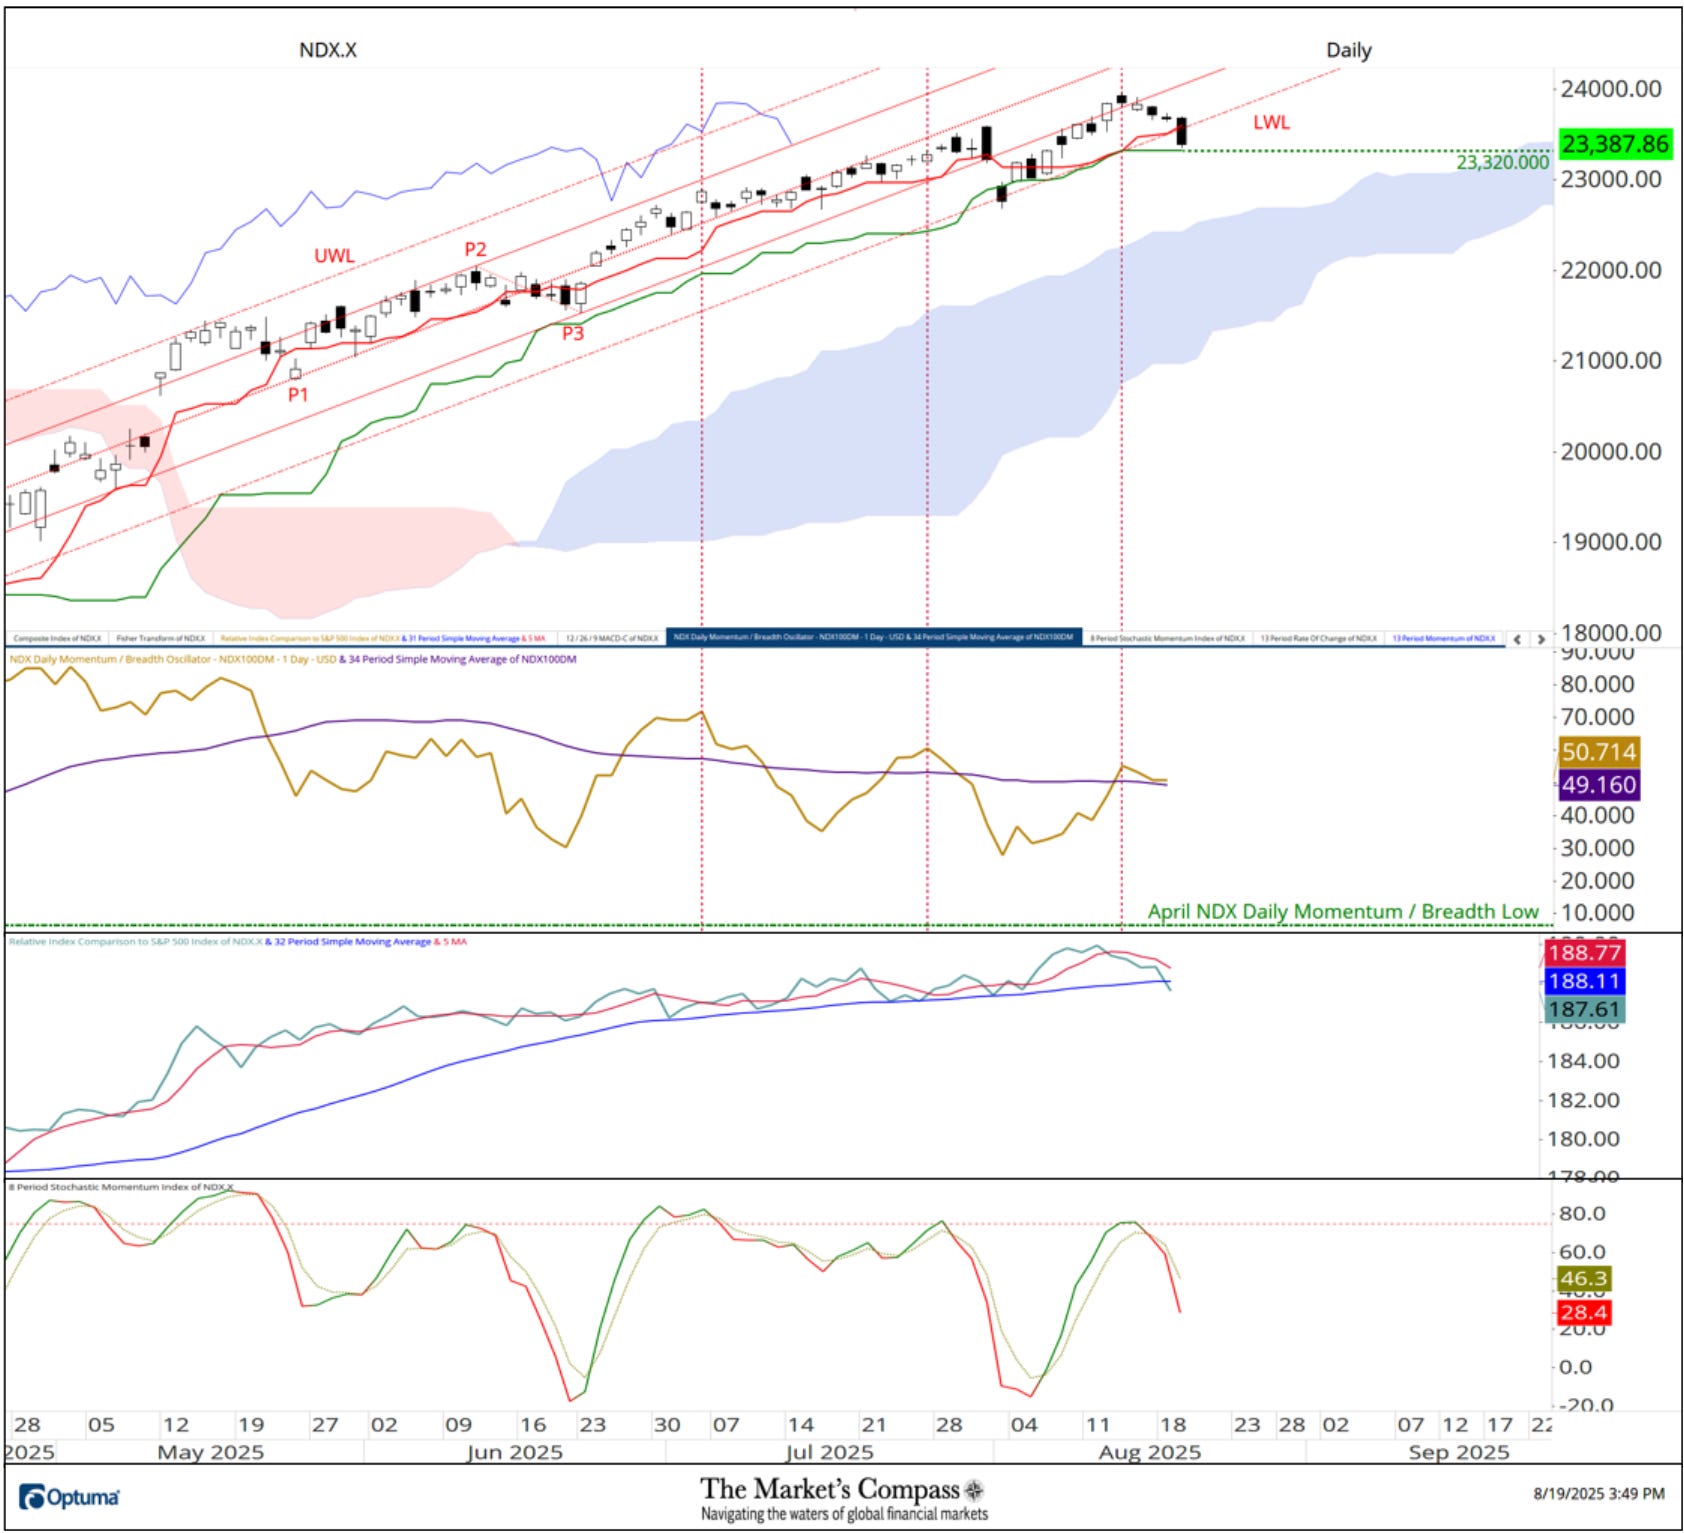
At the risk of being labeled the boy that cried wolf, there are early signs of a crack in the back of the NASDAQ 100 Index’s rally. These include a violation of the Lower Warning Line (dashed red line, LWL) of the Standard Pitchfork (red P1 through P3) after failing to hold the retaken ground above the Lower Parallel (sold red line). I know I’ve been beating a dead horse for weeks, but there continues to be a repeated non-confirmation of the higher price highs in the Momentum / Breadth Oscillator (dashed yellow lines). Not only does it reflect deterioration in upside momentum, but it also speaks to decaying breadth. There are early signs of a break of the trend in relative outperformance versus the SPX as witnessed by a drop below its longer-term moving average (blue line) for the first time in months (a drop of the shorter-term moving average, red line through the longer, would confirm the breakdown). There has been a sharp turn lower in the Stochastic Momentum Index (bottom panel) that at the very least suggests a potential deeper price retracement than we have seen in months. There is no question that I am sticking my neck out with this warning considering that over the next three days there could be news driven volatility in the rates market that will likely overflow into the equity markets. Key support is at the Kijun Plot (green line at 23,320) and second at Cloud support.
Why this matters
This research story adds another data point to the current market tape and is useful when read alongside nearby source coverage.
Original source
Read on The Market's CompassRelated market context

Altcoins Gain Momentum Amid $2.77B Bitcoin ETF Inflows as BTC Rebounds From $82.5K
At the same time, the Bitcoin price is attempting to stabilize after falling toward the $82,500 area, while market data shows trad...

Ethereum (ETH) Price Prediction: Coinbase Buying Picks Up as ETH Eyes a $2,720 Breakout
Ethereum price is consolidating near $2,680 as buyers attempt to maintain the recovery and push through the next resistance zone....

Ethereum Price Prediction: Could Aztec’s zk.money Drive ETH Higher as Zcash Fuels Privacy Narrative?
Ethereum is trading at $2,665, flat over 24 hours, leaving it below the $2,700–$2,735 resistance band as our recent price predicti...

Stretched Profits and Cooling Demand Put Bitcoin Rally on Pause — For Now: Report
Bitcoin Magazine Stretched Profits and Cooling Demand Put Bitcoin Rally on Pause — For Now: Report Bitcoin’s recent run may be slo...
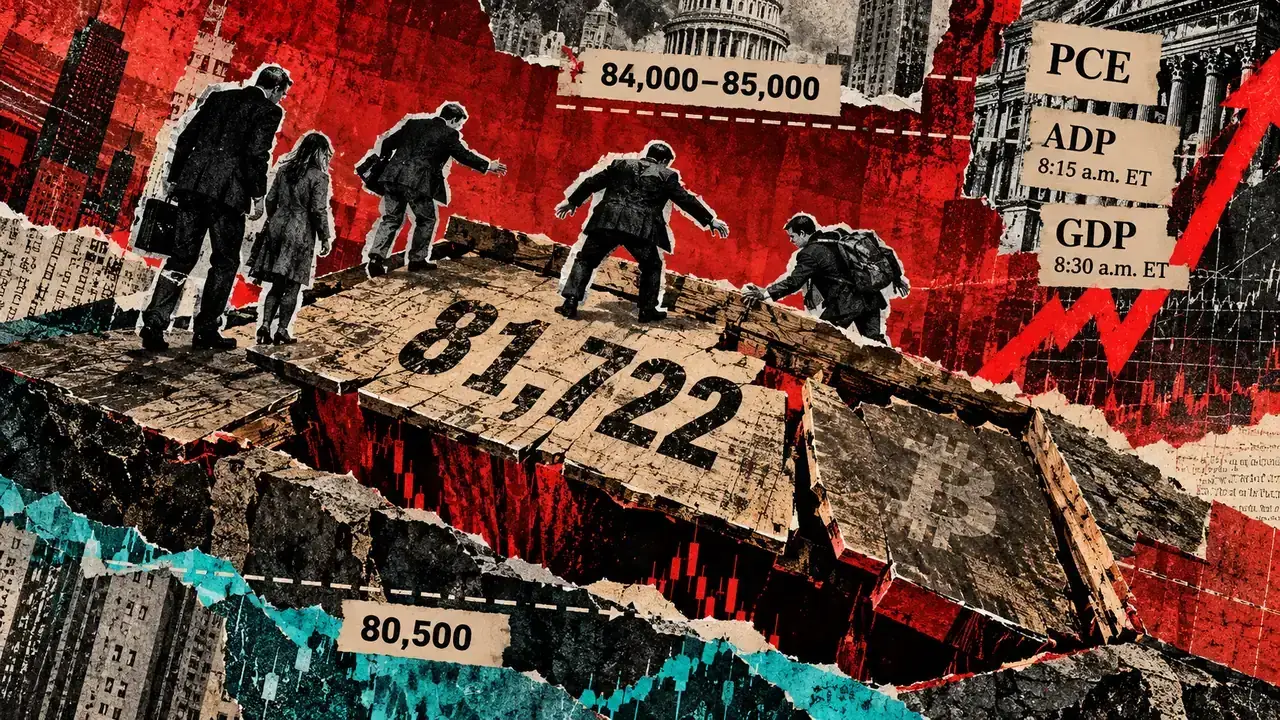
Bitcoin could put the average ETF buyer back in losses this week
Bitcoin registered an intraday low of $82,775.94 on Sept. 29 before rebounding above $83,000, close to a price that could change t...
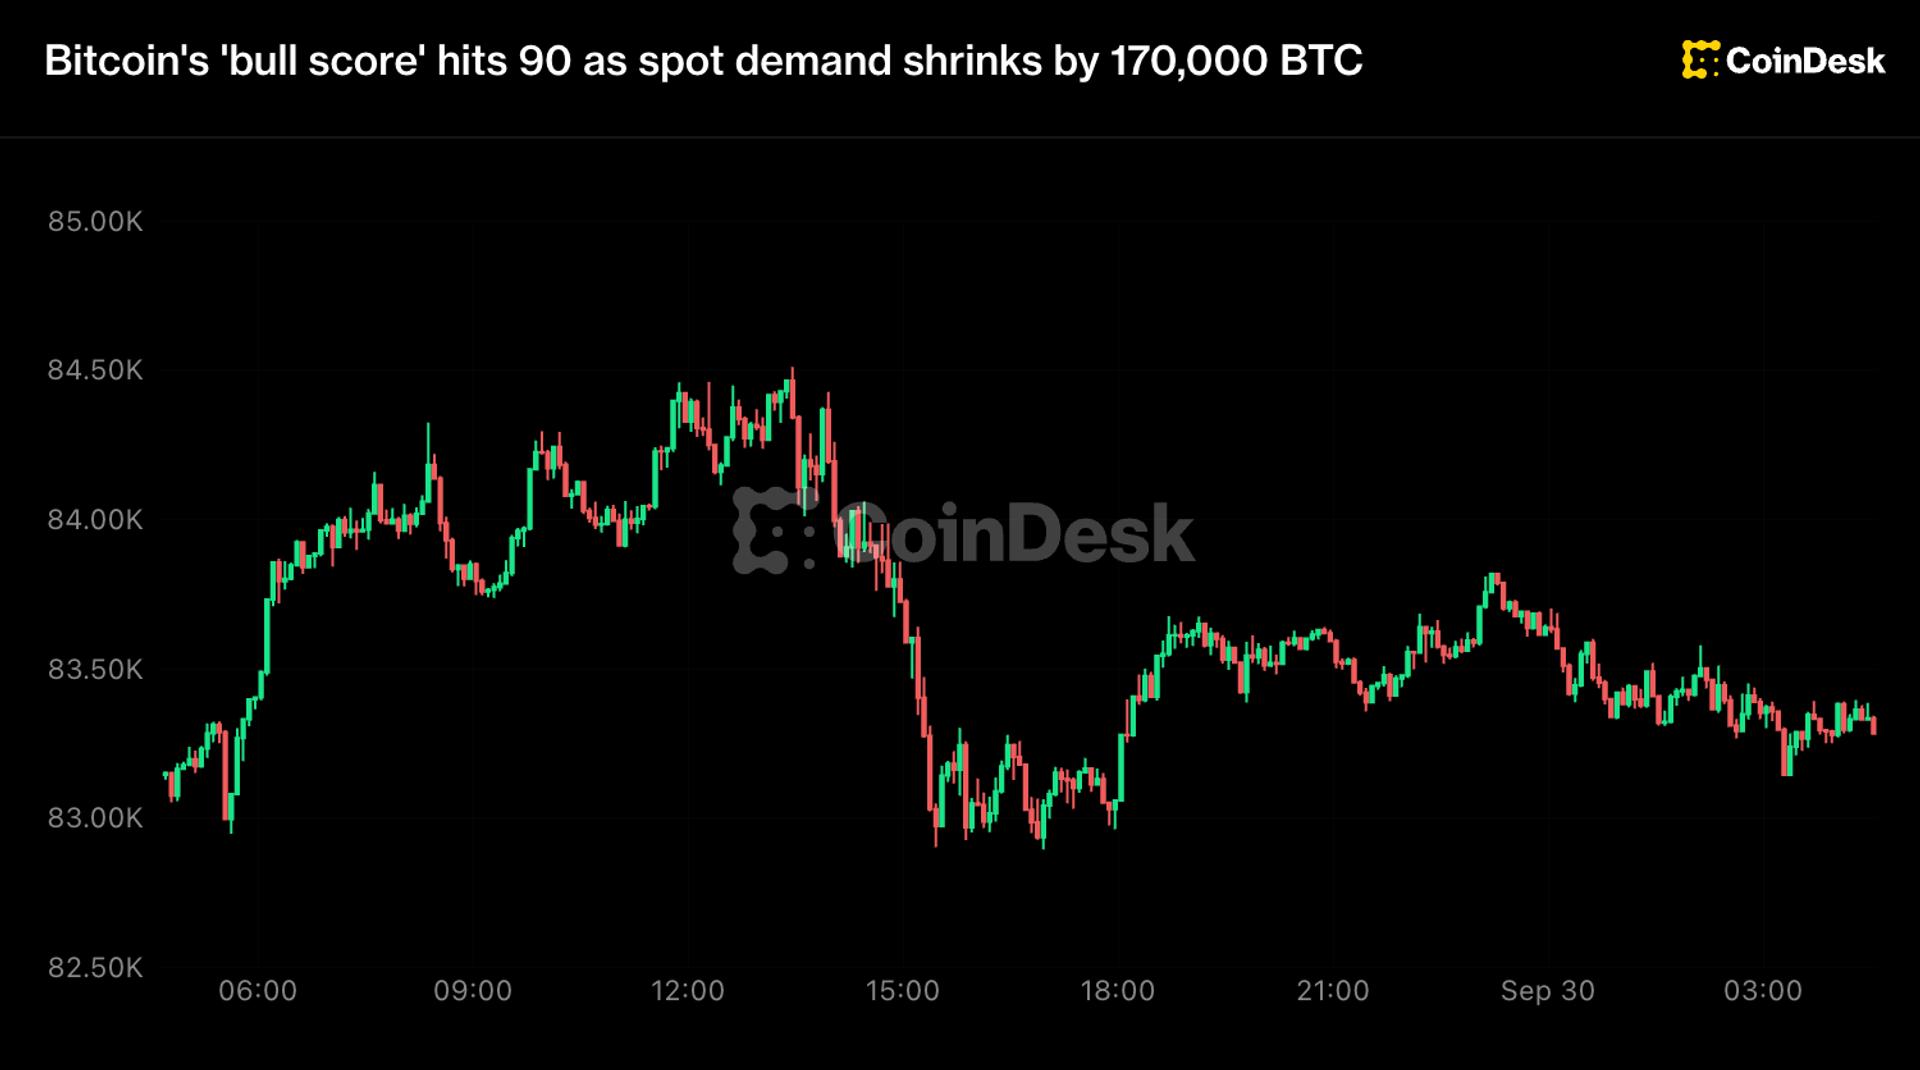
Bitcoin rally shows signs of cooling even as a 'bull score' gauge nears its perfect score
A trend guage tracked on onchain analysis firm CryptoQuant is near its ceiling. The buyers who drove BTC to an eight-month high ar...