HBAR News: Hedera Price Holds $0.22 as Falling Wedge Suggests Breakout
The market has seen consistent accumulation zones forming near $0.22, keeping traders on alert for a potential decisive move. With analysts pointing to a falling wedge pattern, the coin’s current structure shows similari...
Archive context
Older archive item. Useful for background and entity history, but not a fresh market-moving signal.

The market has seen consistent accumulation zones forming near $0.22, keeping traders on alert for a potential decisive move.
With analysts pointing to a falling wedge pattern, the coin’s current structure shows similarities to its last recovery phases. Broader market activity and whale positioning will likely shape the next momentum push.
Falling Wedge Builds PressureIn a recent analysis, market watchers highlighted the development of a falling wedge on the HBAR chart, signaling that a breakout could be imminent. The structure has tightened across September with resistance lines sloping downward while support remains resilient around $0.20.
Historical patterns suggest such wedges often precede upward movements if volume strengthens. The narrowing price action has therefore caught attention, especially as traders monitor whether buyers can reclaim $0.25.
Source: X
The wedge mirrors previous recovery setups seen during June when the coin staged a breakout after prolonged consolidation. Observers underline that the crypto remains technically aligned with bullish wedge mechanics despite the current hesitation. A decisive move above resistance could confirm the setup and shift sentiment more positively. Until then, the wedge acts as a compression zone, preparing the market for resolution.
Key Levels and Market SignalsRecent data shows HBAR consolidating after a steep summer correction, with daily candles reflecting reduced downside pressure. Trading activity has steadied, suggesting accumulation around the $0.21–$0.22 support range. This zone has repeatedly cushioned declines, adding weight to its importance as a foundation for any future rally.
Source: BraveNewCoin
Technical levels now highlight potential resistance targets near $0.29 and $0.33 if momentum builds. The market cap remains around $9.2 billion, reflecting a steady mid-cap profile despite short-term turbulence. Holding the current base becomes essential, as any breakdown under $0.20 could disrupt the bullish wedge setup.
Market observers emphasize that steady defense of support is keeping the token aligned with a rebound thesis. While traders await confirmation, the coin’s compressed structure makes volatility likely in the near term.
Momentum Indicators Turning CriticalAt the time of writing, the coin was trading at $0.22, with technical indicators offering further insight into its next potential move. The Relative Strength Index (RSI) sits at 40.63, placing HBAR near the lower boundary of neutral territory. This suggests the asset is closer to oversold conditions than overbought, often signaling room for upward correction if demand strengthens.
Source: TradingView
Meanwhile, the Moving Average Convergence Divergence (MACD) remains in negative territory, with the histogram showing -86.19M and the signal line lagging. This indicates bearish momentum still lingers, but the flattening of the histogram bars points to a slowdown in selling pressure. Such developments are often early signs of trend exhaustion, paving the way for potential reversals.
Together, these indicators reinforce the broader wedge setup, with momentum slowly shifting from weakness to possible stabilization. Traders watching the RSI recovery and MACD crossover signals may find confirmation if a breakout emerges, aligning technical analysis with structural patterns on the chart.
Why this matters
This research story adds another data point to the current market tape and is useful when read alongside nearby source coverage.
Original source
Read on Brave New CoinRelated market context

XRP Price Prediction: Ripple Range-Bound at $1.50, Breakout Soon?
XRP price prediction shows Ripple entering October still trading within a broad range. XRP is currently around $1.50, with key res...

Bitcoin (BTC) Price Today: 2028 Halving Cycle and BlackRock ETF Inflow Signal Long-Term Rally
Recent market data also show that Bitcoin buyers have absorbed a key sell wall around $85,000, reducing one source of near-term re...

Elon Musk Grok AI Predicts a Wild End to 2026 for Bitcoin
Elon Musk’s Grok AI predicts the next three months will be unusually consequential, projecting Bitcoin could hit an impressive 2x...

XRP Price Prediction: Ripple’s $700M Escrow Return Puts $1.59 Resistance in the Spotlight
The setup comes shortly after Ripple returned 700 million XRP, worth more than $1 billion, to escrow following its scheduled Octob...
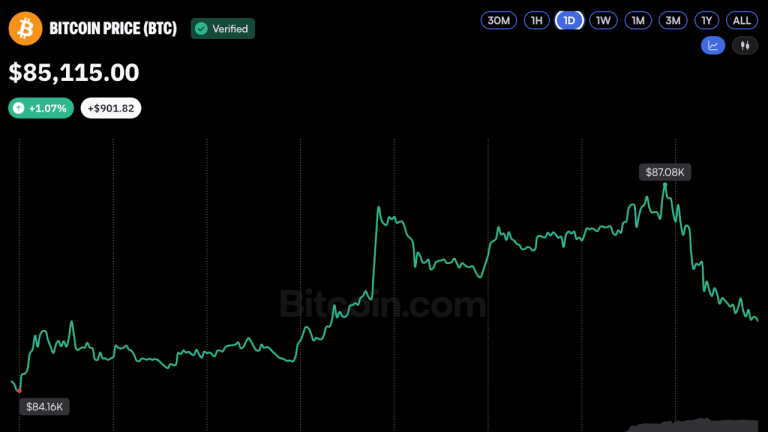
Bitcoin Price Taps $87K as SEC Moves to Unlock Institutional Custody
Driven by weak U.S. employment data and a major SEC regulatory proposal, bitcoin briefly reclaimed $87,000 for the first time sinc...

Crypto Markets Move Fast, But Verification Remains the Bottleneck
Crypto headlines move prices in minutes, but verification lags behind. Why sourcing discipline is the real differentiator in digit...