Hedera Price Prediction: HBAR Breaks Out With Strength as Bullish Signals Target $0.35 Surge
Recent price action signals a shift in sentiment, supported by technical confirmation and consistent network engagement. With growing volume and momentum, HBAR appears to be positioning for a potential move toward the $0...

Recent price action signals a shift in sentiment, supported by technical confirmation and consistent network engagement. With growing volume and momentum, HBAR appears to be positioning for a potential move toward the $0.35 level. Market data and analyst insights suggest a bullish structure may be taking shape.
HBAR Gains Traction Amid Breakout From Key Technical StructureHBAR’s daily chart presents a decisive breakout from a multi-month falling wedge formation. This pattern, historically known for signaling bullish reversals, has unfolded with increasing volume, a metric closely watched to validate price direction.
The breakout occurred above the $0.23 mark and has propelled price movement into a new range. According to analyst Dalin Anderson (@HighAltitudeInv), this structure was confirmed with strong market conviction, and the rally appears to be gaining traction.
Source: X
Additional momentum stems from the presence of a bullish divergence on the MACD indicator. While price action was forming lower lows in previous sessions, the MACD line and histogram were trending upward, indicating diminishing bearish pressure.
Following this signal, HBAR’s MACD line has crossed above the signal line, while histogram bars have turned positive, reflecting accelerating bullish momentum. These indicators suggest that price is entering a new phase, possibly setting the stage for a broader trend reversal above the $0.30 mark.
HBAR Market Fundamentals Show Strength Amid Growing Trading VolumeAt the time of writing, HBAR is trading at $0.23, registering a minor 0.28% daily gain. The token currently ranks #18 by market capitalization, with a total cap of $9.83 billion. It maintains a circulating supply of 42.39 billion tokens, contributing to its deep liquidity and accessibility across major exchanges.
While short-term price movement has been moderate, the underlying fundamentals reflect sustained confidence from both retail and institutional participants.
Source: BraveNewCoin
Trading volume over the last 24 hours stands at approximately $660 million, suggesting active market participation. This volume equates to roughly 7% of the token’s market cap, pointing to possible accumulation during this consolidation phase.
If volume remains elevated in the coming sessions, this could strengthen the breakout structure and support HBAR’s approach toward higher resistance zones, particularly around the $0.28 to $0.35 levels. Market observers continue to monitor whether this momentum can extend further.
Technical Indicators Signal Shift as Bollinger Band Expansion Supports MomentumThe daily chart from TradingView highlights that HBAR recently broke above the basis line of the Bollinger Bands in early July, a key signal of momentum acceleration. This breakout occurred as the price surged above both the middle and upper bands, pushing volatility higher.
The move peaked around $0.35 before a minor retracement brought the price to $0.231. Despite the pullback, the price remains well above the 20-day simple moving average, suggesting the broader uptrend is intact.
Source: TradingView
At the time of writing, the Bollinger Band Power (BBP) indicator is reading 0.05728, reflecting a significant increase in price volatility. BBP had been negative during prior weeks, indicating subdued price activity.
The current shift into positive territory aligns with the breakout and signals a change in momentum strength. However, as price now tests the upper band, near-term consolidation may occur before a renewed push. Provided support between $0.20 and $0.22 holds, HBAR may continue its upward trajectory, with $0.35 as a primary upside target.
Original source
Read on Brave New CoinRelated market context

Bitcoin price challenges $64,000 weekend wall – needing a breakout or risk a deeper correction
Bitcoin reclaimed $64,000 on June 12 and touched an intraday high of $64,301 in the same session that spot ETF flows finally flipp...
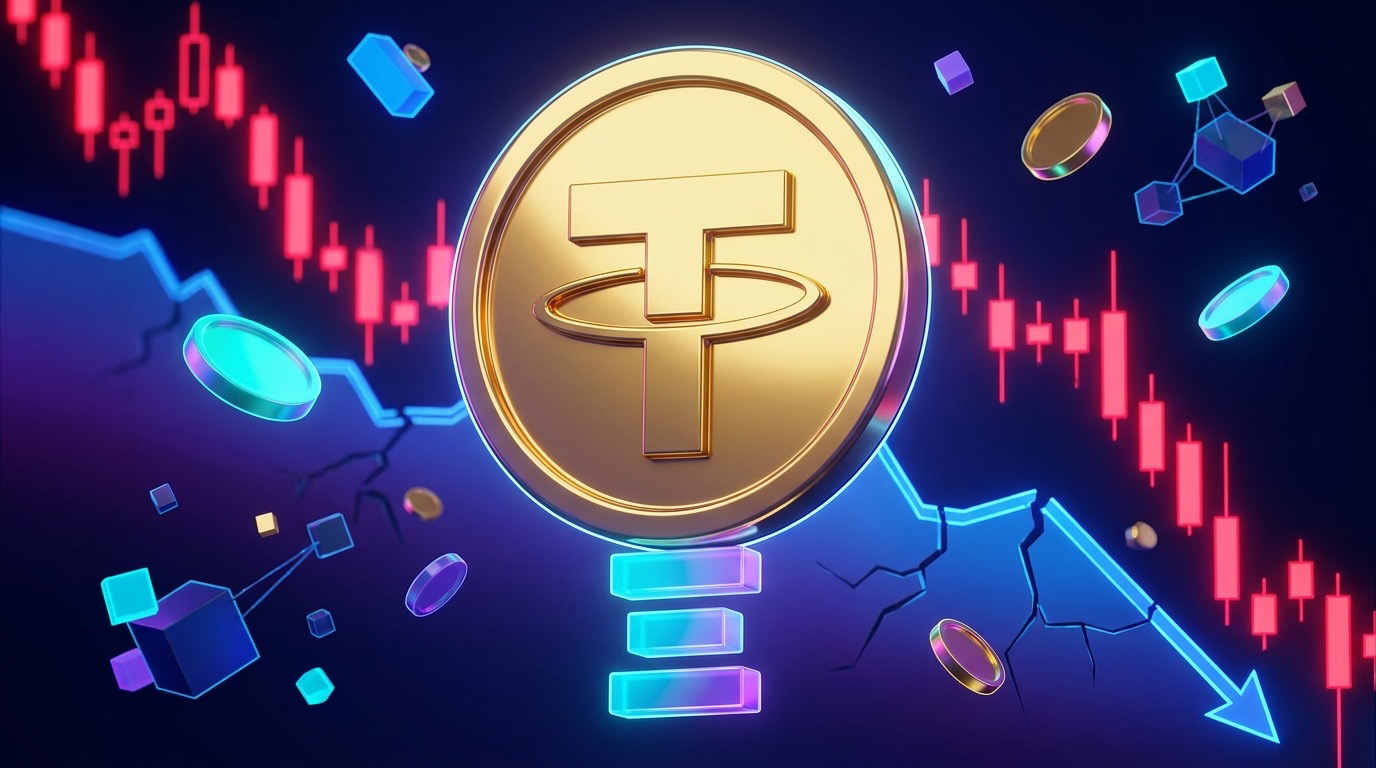
Tether’s Brief Overtaking of Ether in Value Signals Crypto Market Stress
USDT briefly surpassed Ether in market cap last weekend, signalling investor flight to safety amid Bitcoin's worst week since FTX...

Reuters Currency Headlines Hint at Macro Shift for Bitcoin and Crypto Markets
Reuters currency market headlines hint at macroeconomic pressures affecting Bitcoin and crypto. Analysis of fiat moves and regulat...

Elon Musk’s trillionaire status puts his net worth above crypto’s entire market cap outside Bitcoin
Elon Musk has become the first person in modern history to amass a personal net worth exceeding $1 trillion, crossing the historic...

Uranium Holds Above $85 as Mining ETF Rebounds From June Sell-Off
The latest charts display that the market is divided into stable physical prices and uranium shares trying to regain momentum afte...

Google Gemini AI Predicts Jaw-Dropping XRP Price For Next 90 Days
Google Gemini AI just put XRP back under the spotlight, predicting it is tightly wound for a major breakout toward $1.60 to $1.80...