Optimism Price Prediction: Major Reversal and Volume Spike Could Signal New Trend
This combination of price correction and increased market participation may point to increased volatility ahead and the possibility of a new directional move for this digital asset. Price Moves Reflect a Sharp Reversal F...
Archive context
Older archive item. Useful for background and entity history, but not a fresh market-moving signal.

This combination of price correction and increased market participation may point to increased volatility ahead and the possibility of a new directional move for this digital asset.
Price Moves Reflect a Sharp Reversal Following an Extended RallySince early August, the coin displayed a strong and consistent uptrend, reaching a peak of approximately $0.82. The rise was marked by a series of higher highs and lows, supported by increasing market engagement as reflected in the growth of aggregated open interest in derivative contracts.
Recent price data shows a marked pullback from this peak, with a succession of red candles evidencing robust selling pressure. The current price rests near $0.77, with the latest candle indicating a minor bounce or indecision, which suggests some traders may be taking profits or reacting cautiously after the steep decline.
Source: Open Interest
Aggregated open interest reveals that the volume of outstanding derivatives also increased in tandem with the price rise, confirming the rally’s underlying strength and participation by leveraged traders. However, during the recent pullback, open interest has slightly decreased but remains elevated at around 99.5 billion.
This reduction implies that some leveraged positions might have been liquidated or closed out, possibly causing or accelerating the correction. These developments highlight the asset’s susceptibility to short-term fluctuations, particularly following strong, leveraged price advances.
Volume Spike Highlights Increased Market ParticipationAdditionally, the 24-hour trading volume has seen a significant surge, exceeding $274 million, correlating with the recent sharp price bounce. This substantial increase in volume confirms that the rapid recovery was supported by an influx of trading activity rather than isolated or low-liquidity events.
The large participation reflects strong buyer interest emerging at lower price levels, effectively counteracting earlier selling pressure and producing a pronounced V-shaped price recovery.
Source: BraveNewCoin
This volume surge demonstrates heightened engagement by market participants, which often precedes important trend decisions. The alignment of high trading volume with a sharp price bounce signals robust liquidity and increased confidence among traders that price levels around $0.75 to $0.80 represent key battlegrounds between bullish and bearish forces.
Technical Indicators Signal Consolidation Amid Market UncertaintyOn the other hand, examining the daily chart, the price recently rose above the mid-Bollinger Band and briefly touched the upper band before retreating to trade near the mid-band level.
This positioning often indicates a phase of consolidation after a pronounced move, implying that the asset is temporarily balancing between upward momentum and selling forces. The current red daily candle supports the view of a short-term retracement or indecision in the market.
Source: TradingView
The Relative Strength Index (RSI) remains moderately bullish, resting at approximately 58, above the neutral midpoint of 50 but well below overbought thresholds. The RSI’s recent decline from near-overbought conditions aligns with the price pullback, signaling a cooling of bullish momentum. Meanwhile, the RSI remains above its moving average, suggesting some underlying positive sentiment persists despite short-term volatility.
This interplay of price action and momentum indicators suggests that the crypto is navigating a consolidation phase, with traders monitoring critical support near the mid-Bollinger Band. Whether the price manages to hold this level and resume its upward trend or breaks below it to signal further correction will likely determine the near-term trajectory.
Why this matters
This research story adds another data point to the current market tape and is useful when read alongside nearby source coverage.
Original source
Read on Brave New CoinRelated market context

Bitcoin (BTC) Price Today: 2028 Halving Cycle and BlackRock ETF Inflow Signal Long-Term Rally
Recent market data also show that Bitcoin buyers have absorbed a key sell wall around $85,000, reducing one source of near-term re...

Elon Musk Grok AI Predicts a Wild End to 2026 for Bitcoin
Elon Musk’s Grok AI predicts the next three months will be unusually consequential, projecting Bitcoin could hit an impressive 2x...

Bitcoin Price Surges Above $87,000 on Softer-Than-Expected Jobs Data
Bitcoin Magazine Bitcoin Price Surges Above $87,000 on Softer-Than-Expected Jobs Data The price of bitcoin surged above $87,000 on...

XRP Price Prediction: Ripple Range-Bound at $1.50, Breakout Soon?
XRP price prediction shows Ripple entering October still trading within a broad range. XRP is currently around $1.50, with key res...

XRP Price Prediction: Ripple’s $700M Escrow Return Puts $1.59 Resistance in the Spotlight
The setup comes shortly after Ripple returned 700 million XRP, worth more than $1 billion, to escrow following its scheduled Octob...
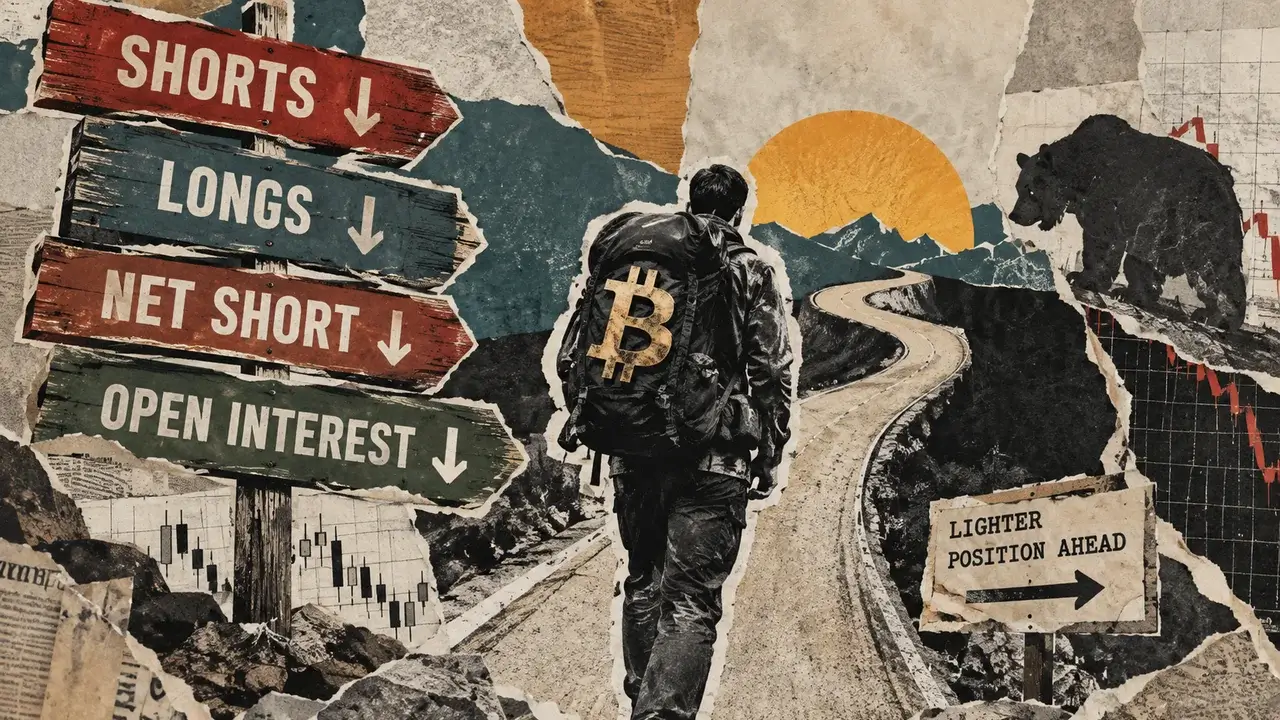
Leveraged funds’ Bitcoin futures shorts fall by 5,300 BTC-equivalent as longs shrink
Leveraged funds’ reported Bitcoin futures shorts fell by about 5,300 BTC-equivalent in the week to Sept. 29, narrowing their net s...