Uniswap Price Prediction: UNI Eyes $7.80 as Bulls Hold Key Support Level
Uniswap (UNI) is hovering near a critical zone after recovering from earlier losses this month. The token has been trading between $7.20 and $7.60, showing short-term resilience while attempting to build momentum. With t...
Archive context
Older archive item. Useful for background and entity history, but not a fresh market-moving signal.

Uniswap (UNI) is hovering near a critical zone after recovering from earlier losses this month. The token has been trading between $7.20 and $7.60, showing short-term resilience while attempting to build momentum. With technical indicators pointing to consolidation and speculative interest rising in derivatives, market participants are watching for signs of a sustained breakout.
Uniswap Derivatives Data Shows Momentum as Open Interest RisesThe 1-hour candlestick chart for UNI/USD on Open Interest reflects ongoing price consolidation within a broader recovery from early-month lows. After rebounding from sub-$6.50 levels, UNI reached a high of approximately $7.80 on July 6 before entering a period of reduced volatility.
Uniswap price action since then has remained bound between $7.20 and $7.60, with recent candlesticks displaying narrow ranges and upper wicks, suggesting slowing bullish momentum around the $7.40 mark.
Source: Chart by Open Interest
A notable development has been the sharp rise in aggregated open interest. Data shows that open interest in UNI derivatives surged from below 4 million to a peak above 6 million on July 6, before stabilizing around 5.45 million. This elevated figure signals increased speculative engagement, potentially in anticipation of a price breakout.
The modest decline in open interest following its peak could indicate profit-taking, but the sustained high levels point to continued market engagement and potential volatility in upcoming sessions.
A break above the $7.60 resistance level, if accompanied by volume and renewed open interest expansion, could push UNI toward the $7.80 mark. Conversely, failure to hold the $7.20 support may result in a retracement toward the $6.80 region. Traders are closely observing these thresholds for confirmation of the next directional move.
Intraday Structure Hints at Accumulation Near Key LevelsThe 24-hour price chart for UNI suggests a mild upward trajectory characterized by higher lows and moderate volume support. After opening near $7.35, UNI experienced minor pullbacks before climbing to a session high of $7.48. Despite brief periods of volatility, the structure of ascending lows and highs indicates incremental buying pressure during the trading day.
Source: Chart by BraveNewCoin
Total trading volume during this period reached approximately $277 million. The majority of this activity occurred in the latter half of the day, aligning with the most pronounced price advances. This correlation between volume and upward movement suggests genuine interest rather than speculative price fluctuation.
At the time of reporting, UNI is priced at $7.41 with a marginal 0.35% decline over the 24-hour window. The token holds a market capitalization of approximately $4.45 billion, ranking it 35th among digital assets by valuation.
Holding above the $7.30 zone may be crucial for sustaining current momentum. Should volume remain elevated and resistance near $7.50 be broken, buyers could test higher levels, bringing $7.80 back into focus. Market observers continue to track volume consistency and structural shifts in support zones for confirmation of trend continuation.
Technical Indicators Signal Mild Bullish MomentumOn the daily timeframe, UNI price remains within a consolidation range between $6.80 and $7.50. This horizontal movement follows an earlier drawdown from a yearly high near $14.84, with recent sessions reflecting market indecision. The current price of $7.409 is supported by modest bullish candles, suggesting an attempt to build a base for a potential move higher. However, a definitive trend will likely require additional technical validation.
Source: Chart by TradingView
The Relative Strength Index (RSI) reads 54.17, slightly above the midpoint, while its moving average is at 52.23. This positioning reflects mild upward pressure but falls short of a clear momentum signal.
A move above 60 on the RSI could indicate a stronger bullish conviction. In parallel, the MACD line has crossed above the signal line, and the histogram shows a small positive value of 0.021, suggesting a potential trend shift. Yet, the narrow divergence indicates the current rally lacks force, reinforcing the need for sustained buying volume to fuel further gains.
As of July 8, 2025, traders continue to monitor whether UNI price can maintain a price above $7.30 and break past resistance near $7.50. If successful, the next upside target near $7.80 may come into range, setting the tone for UNI’s short-term market direction.
Why this matters
This research story adds another data point to the current market tape and is useful when read alongside nearby source coverage.
Original source
Read on Brave New CoinRelated market context

Microsoft Copilot AI Predicts Chainlink (LINK) Could Hit $100 in 2026
Microsoft Copilot AI predicts that in a world where Chainlink becomes the backbone of a major global settlement system, such as SW...

Mark Zuckerberg Meta AI Predicts Double-Digit XRP Price by 2026
Currently priced at approximately $1.50, Mark Zuckerberg’s Meta AI predicts that XRP could surge above $10 this year, a gain of ar...
Bitcoin surges 43% in Q3 as Treasury yields hit highest levels since 2007
Bitcoin's Q3 surge highlights its vulnerability to macroeconomic shifts, as rising Treasury yields challenge its appeal amid tight...
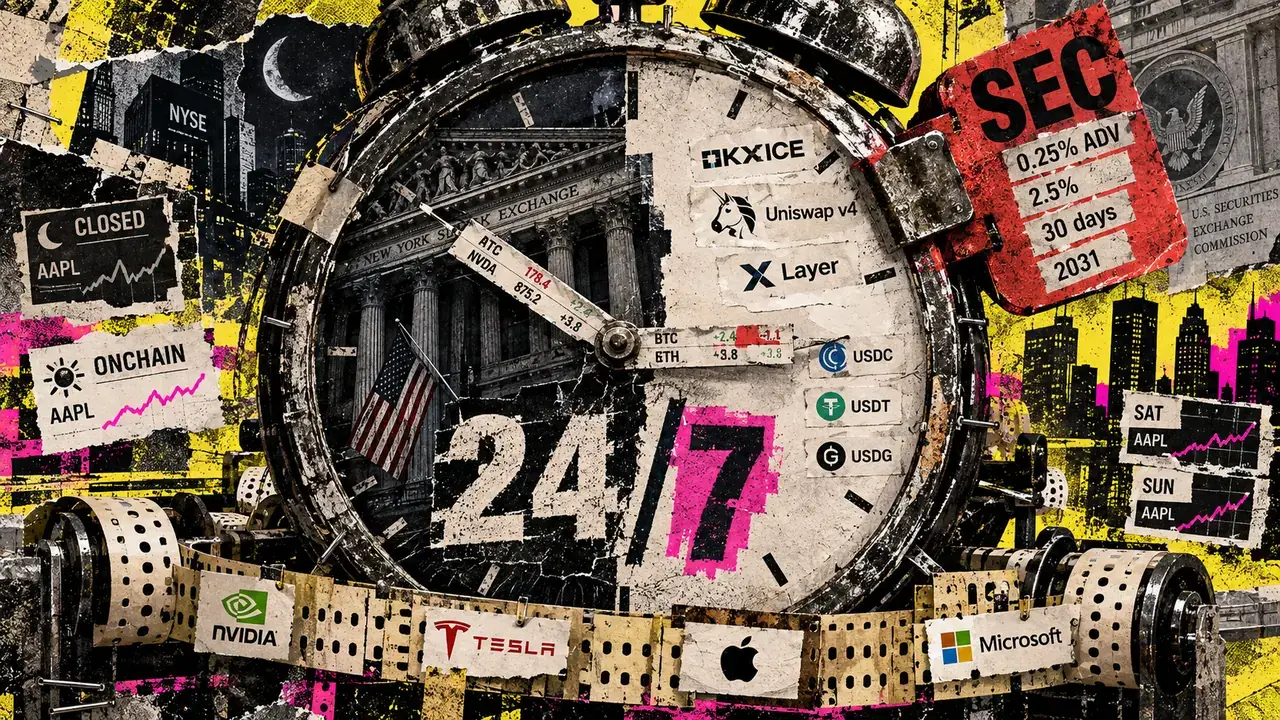
NYSE owner and OKX plan 24/7 tokenized stock trading using Uniswap
Intercontinental Exchange and OKX are preparing an always-open market where tokenized US stocks could keep repricing after Wall St...

Bitcoin Price Stays Out of the Red as This Bear Market Breaks a Historic Pattern
Bitcoin price drawdown never produced a daily close below realized price this cycle, while aggregate NUPL remained positive throug...

Near Protocol ETF Puts NEAR Back on Institutional Investors’ Radar
Bitwise Investment Advisers’ Bitwise NEAR Protocol ETF, ticker NRR, is designed to hold NEAR directly and seek additional tokens t...