Worldcoin Price Eyes Breakout as WLD Retests $1.40 Resistance Zone
The token briefly recovered from sub-$1 levels in early July but encountered resistance near the $1.40 region. Technical indicators now suggest WLD is approaching a critical juncture, with bulls eyeing a breakout while s...

The token briefly recovered from sub-$1 levels in early July but encountered resistance near the $1.40 region. Technical indicators now suggest WLD is approaching a critical juncture, with bulls eyeing a breakout while sellers remain active. At the time of writing, WLD is priced at $1.007, reflecting a 4.28% intraday loss.
Worldcoin Price Structure and Resistance ZonesAccording to a recent chart shared by Kriptoteless, WLD/USDT remains below a short-term resistance block between $1.40 and $2.00, marked by repeated price rejections over the past few weeks. The chart identifies this red resistance zone as a key ceiling, with the token currently testing its lower boundary.
Beyond this range, the analyst mapped out potential mid-term and long-term targets at $3.681 and $5.290, respectively. These levels represent critical breakout targets if upward momentum is sustained.
Source: X
Support appears to be forming near the $0.90–$1.00 region, a range that has seen increased participation in recent sessions. Volume indicators show growing activity as WLD approaches resistance, which could help propel the asset if it clears the overhead supply. However, a failure to break above this range may prompt a pullback, potentially leading to a retest of previous lows. Kriptoteless emphasized that a sustained move beyond $2.00 would likely shift the market structure into a bullish phase with expanded upside targets.
Market Sentiment Reflects Short-Term WeaknessAdditionally, WLD’s 24-hour chart shows a 7.08% drop, falling from a local high of $1.06 to around $1.01 before settling slightly lower. This steady decline unfolded over multiple sessions, punctuated by minor rebounds, but ultimately maintained a bearish trajectory.
The price weakened after July 14, losing momentum and falling below $1.02 in the early hours of July 15. Despite this pullback, the $1.00 level has acted as a critical psychological support zone throughout.
Source: BraveNewCoin
Trading volume during the decline remained relatively strong, reaching $400 million, with $326.63 million recorded over the past 24 hours. However, volume bars show a declining trend as the price fell, indicating potential buyer hesitation or broader market caution.
The price-volume divergence suggests that unless volume returns decisively at support, WLD may face further weakness. The token’s market capitalization stands at $1.75 billion, supported by a circulating supply of 1.73 billion WLD, placing it at Rank 71 globally.
Indicators Signal Cautious Recovery PotentialOn the other hand, the WLD/USDT daily chart highlights a prior breakout attempt that stalled above $1.05, followed by a corrective move. Price remains above $1.00, which continues to serve as a short-term pivot. Technical indicators now suggest early signs of recovery, though confirmation is still pending.
The MACD indicator shows a positive crossover, with the MACD line at 0.014 above the signal line at -0.007, and a histogram value of 0.022, indicating developing bullish momentum.
Source: TradingView
The Relative Strength Index (RSI) prints at 53.71, slightly above the neutral line of 50, pointing toward a mild bullish bias. Recent RSI behavior reflects a gradual climb without breaching overbought territory, which supports the possibility of continued upside.
However, any move below 50 on the RSI or a bearish MACD crossover could signal renewed selling pressure. For WLD to extend its rebound, the price must hold above $1.00 and begin closing above $1.10–$1.20, supported by rising volume and strengthening momentum.
Original source
Read on Brave New CoinRelated market context

Bitcoin price challenges $64,000 weekend wall – needing a breakout or risk a deeper correction
Bitcoin reclaimed $64,000 on June 12 and touched an intraday high of $64,301 in the same session that spot ETF flows finally flipp...

Google Gemini AI Predicts Jaw-Dropping XRP Price For Next 90 Days
Google Gemini AI just put XRP back under the spotlight, predicting it is tightly wound for a major breakout toward $1.60 to $1.80...

World Cup Group B standings remain tied after first round as crypto sponsors eye fan token momentum
The tied standings in World Cup Group B highlight the potential volatility and trading opportunities for fan tokens, impacting cry...

Elon Musk SpaceX AI Predicts Incredible Bitcoin Price For Next 30 Days
Here is the thing about capitulation calls. They only sound smart in hindsight. Right now, with Bitcoin price scraping along the l...
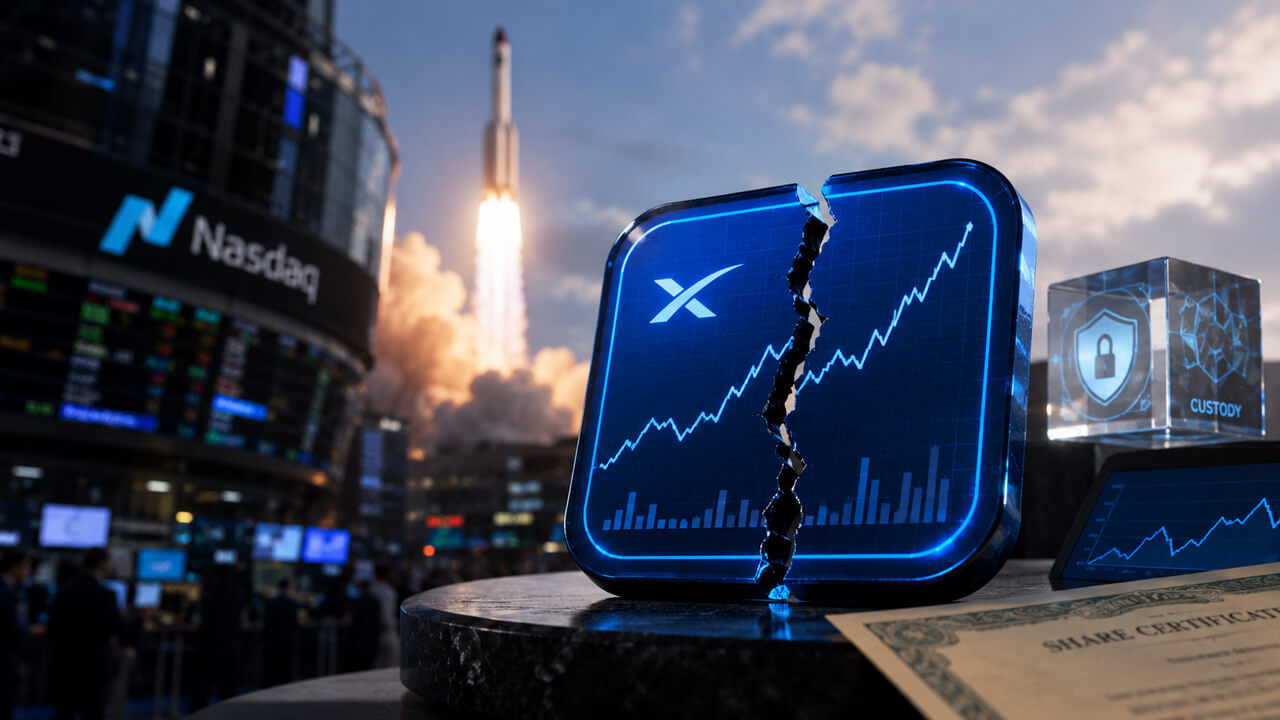
SpaceX’s IPO exposes the first crack in tokenized stocks – fragmented ownership and allocation
SpaceX priced its IPO at $135 per share on June 11, raised $75 billion in the largest public offering in history, and opened on Na...

Bitcoin faces one of its biggest mining difficulty drops as miner margins collapse
The Bitcoin network is poised to execute one of the largest downward adjustments to its mining difficulty in its 17-year history t...