BNB Price Corrects Gains After Strong Rally – Is It Just a Healthy Pullback?
BNB price is correcting gains from the $860 zone. The price is now facing hurdles near $820 and might dip again toward the $788 support. BNB price is correcting gains and traded below the $820 support zone. The price is...
Archive context
Older archive item. Useful for background and entity history, but not a fresh market-moving signal.

BNB price is correcting gains from the $860 zone. The price is now facing hurdles near $820 and might dip again toward the $788 support.
- BNB price is correcting gains and traded below the $820 support zone.
- The price is now trading below $810 and the 100-hourly simple moving average.
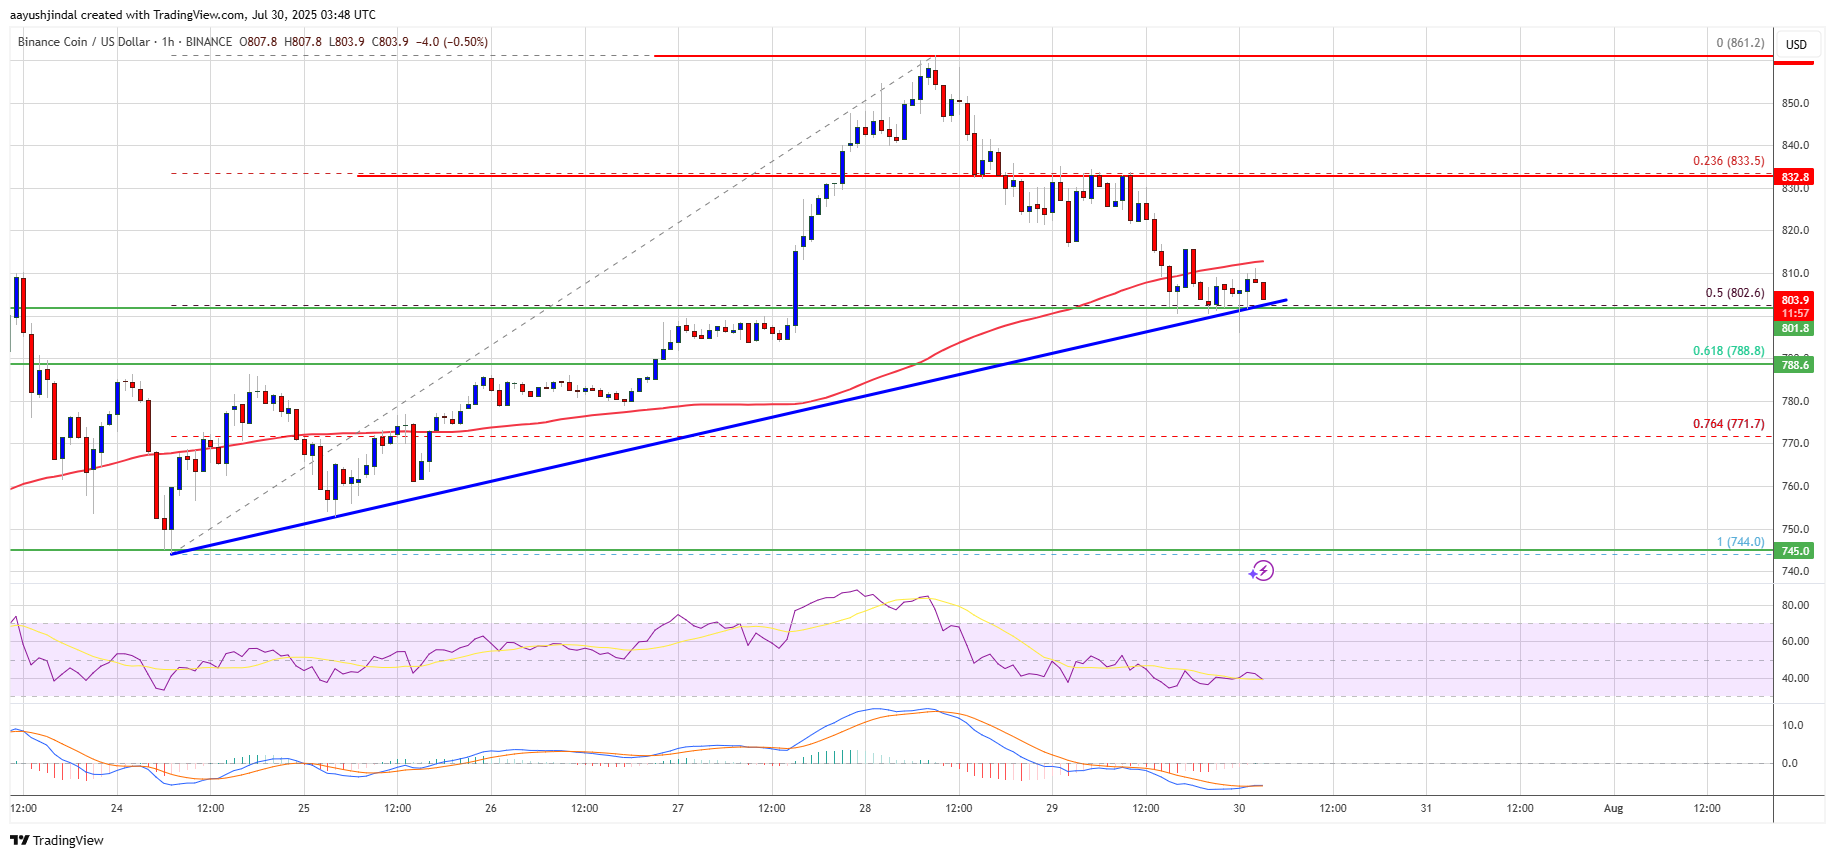
- There is a key bullish trend line forming with support at $800 on the hourly chart of the BNB/USD pair (data source from Binance).
- The pair must stay above the $788 level to start another increase in the near term.
After a steady increase, BNB price failed to clear the $860 zone. There was a downside correction below the $850 and $680 levels, like Ethereum and Bitcoin.
The price even dipped below $840 and tested $800. There was a clear move below the 23.6% Fib retracement level of the upward move from the $744 swing low to the $861 high. The bulls are now active near the $800 support zone.
There is also a key bullish trend line forming with support at $800 on the hourly chart of the BNB/USD pair. The price is now trading below $810 and the 100-hourly simple moving average.
On the upside, the price could face resistance near the $810 level. The next resistance sits near the $820 level. A clear move above the $820 zone could send the price higher. In the stated case, BNB price could test $845. A close above the $845 resistance might set the pace for a larger move toward the $860 resistance. Any more gains might call for a test of the $880 level in the near term.
More Losses?If BNB fails to clear the $820 resistance, it could start another decline. Initial support on the downside is near the $800 level. The next major support is near the $788 level.
The main support sits at $770. If there is a downside break below the $770 support, the price could drop toward the $750 support. Any more losses could initiate a larger decline toward the $735 level.
Technical Indicators
Hourly MACD – The MACD for BNB/USD is gaining pace in the bearish zone.
Hourly RSI (Relative Strength Index) – The RSI for BNB/USD is currently below the 50 level.
Major Support Levels – $800 and $788.
Major Resistance Levels – $810 and $820.
Why this matters
This altcoin story adds another data point to the current market tape and is useful when read alongside nearby source coverage.
Original source
Read on NewsBTCRelated market context

XRP Price Prediction: XRP Faces Critical Resistance Near $1.17 Despite Ripple Securing Landmark EU License
While the company secured a full MiCA license that expands its operations across the European Economic Area, market indicators sug...

Bitcoin (BTC) Price Prediction: BTC Holds $63K Support—Can Rising Active Addresses Offset Bearish Technical Signals?
Although the BTC price has remained near a key support zone, recent chart signals and Strategy’s sale of a portion of its Bitcoin...

Bitcoin price rebounds to $63K as leverage returns creating short term volatility risk
Bitcoin's rebound has cleared the first test: price recovered. The harder one starts now: proving buyers remain after the squeeze....

Bitcoin dominance hits one-month low as altcoin winners start breaking away
Bitcoin's dominance dropped to a one-month low of 54%, down from 58.12%, according to CoinGecko's dominance table. Over the same s...

Strategy Sells 3,588 Bitcoin to Fund Dividends as Saylor’s Treasury Model Meets Its First Real Test
Strategy (MSTR), the Michael Saylor–led company that turned corporate bitcoin accumulation into a Wall Street phenomenon, disclose...

Coinbase World Cup error shows prediction markets still have a proof problem
A reported Coinbase announcement about a World Cup result, likely using AI, created a problem bigger than a flawed alert. It showe...