BNB Price Surges to Fresh ATH – Can Bulls Push Toward $1K?
BNB price is gaining pace above the $885 zone. The price is now showing positive signs and might aim for a move above the $920 level in the near term. BNB price started a fresh increase above the $880 and $900 levels. Th...
Archive context
Older archive item. Useful for background and entity history, but not a fresh market-moving signal.

BNB price is gaining pace above the $885 zone. The price is now showing positive signs and might aim for a move above the $920 level in the near term.
- BNB price started a fresh increase above the $880 and $900 levels.
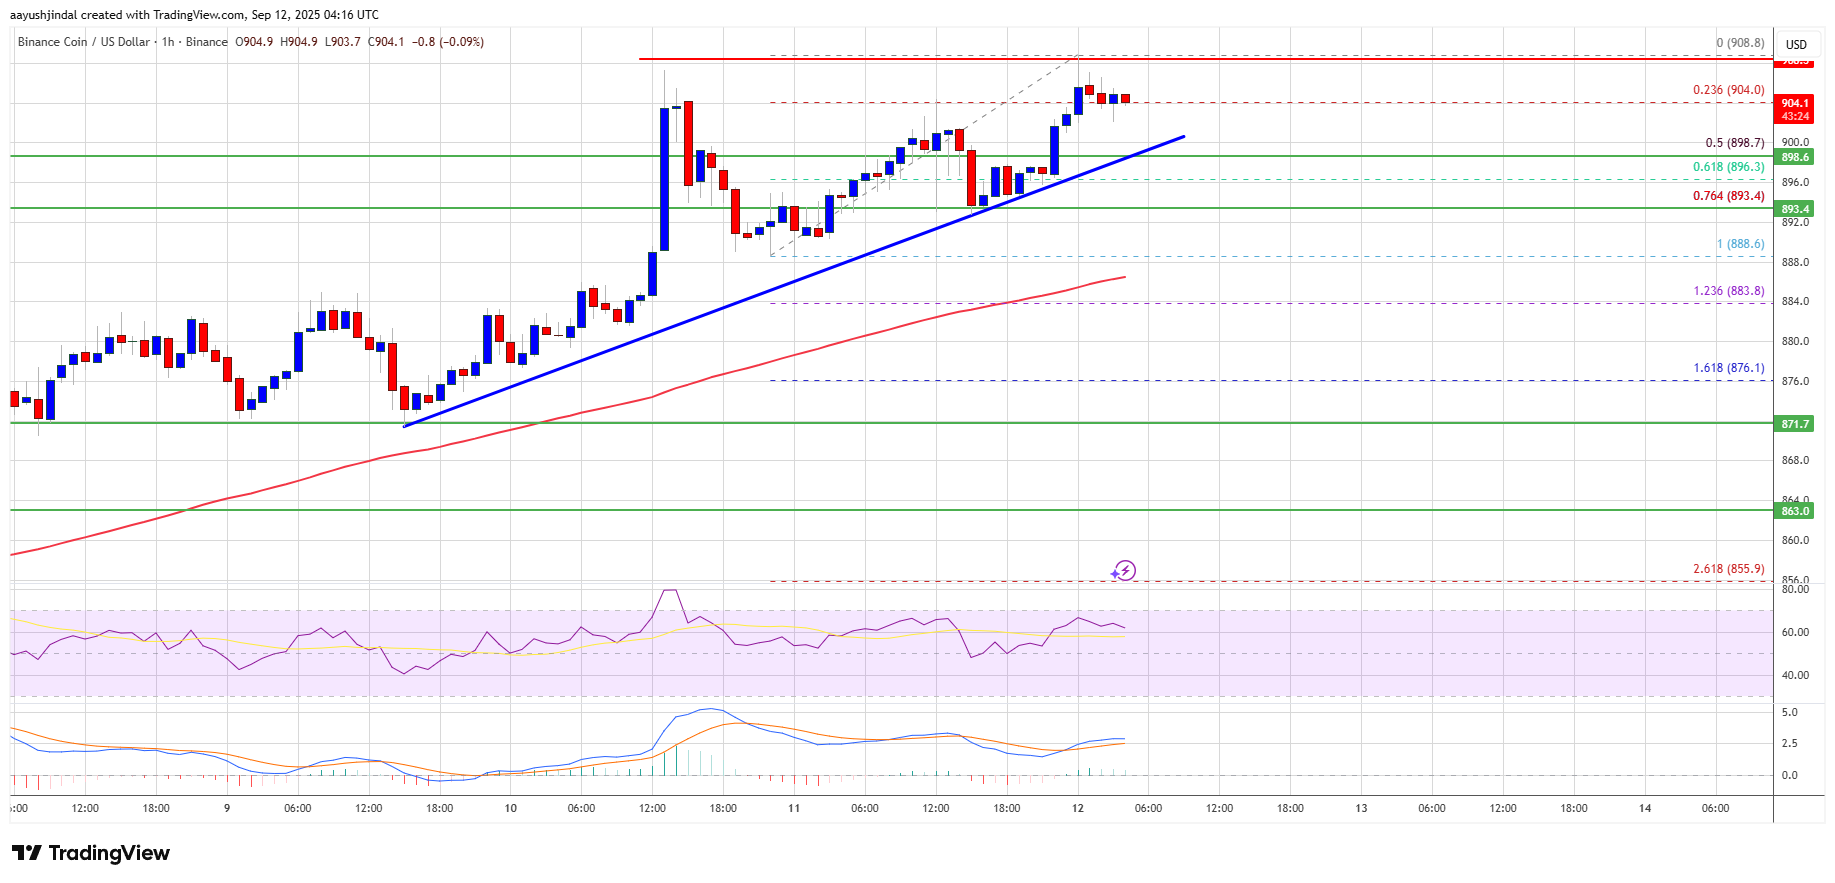
- The price is now trading above $900 and the 100-hourly simple moving average.
- There is a key bullish trend line forming with support at $898 on the hourly chart of the BNB/USD pair (data source from Binance).
- The pair must stay above the $885 level to start another increase in the near term.
BNB price formed a base above the $850 level and started a fresh increase, beating Ethereum and Bitcoin. There was a steady move above the $870 and $885 levels.
The bulls even cleared the $895 resistance zone. A new all-time high was formed at $908 and the price is now consolidating gains. It is trading near the 23.6% Fib retracement level of the upward move from the $888 swing low to the $908 high.
The price is now trading above $900 and the 100-hourly simple moving average. Besides, there is a key bullish trend line forming with support at $898 on the hourly chart of the BNB/USD pair.
On the upside, the price could face resistance near the $908 level. The next resistance sits near the $912 level. A clear move above the $912 zone could send the price higher. In the stated case, BNB price could test $920. A close above the $920 resistance might set the pace for a larger move toward the $945 resistance. Any more gains might call for a test of the $1,000 handle in the near term.
Short-Term Pullback?If BNB fails to clear the $908 resistance, it could start another decline. Initial support on the downside is near the $898 level. The next major support is near the $893 level or the 76.4% Fib retracement level of the upward move from the $888 swing low to the $908 high.
The main support sits at $888. If there is a downside break below the $888 support, the price could drop toward the $872 support. Any more losses could initiate a larger decline toward the $865 level.
Technical Indicators
Hourly MACD – The MACD for BNB/USD is gaining pace in the bullish zone.
Hourly RSI (Relative Strength Index) – The RSI for BNB/USD is currently above the 50 level.
Major Support Levels – $898 and $888.
Major Resistance Levels – $908 and $920.
Why this matters
This altcoin story adds another data point to the current market tape and is useful when read alongside nearby source coverage.
Original source
Read on NewsBTCRelated market context

XRP Price Prediction: XRP Faces Critical Resistance Near $1.17 Despite Ripple Securing Landmark EU License
While the company secured a full MiCA license that expands its operations across the European Economic Area, market indicators sug...

Crypto News, July 8: U.S. Strikes Iran Again, Ethereum Price Wobbles After Bitcoin Spot Sell-Off
Crypto markets woke up to fresh news as U.S. strikes hit Iran again. The Bitcoin price is stuck chopping between $62,000 and $64,5...

Sam Altman ChatGPT AI Predicts Insane Bitcoin Price by 2026
Sam Altman ChatGPT AI just circled November on the calendar and put a number next to Bitcoin Price Prediction. The model predicts...

Ethereum is losing ownership of crypto payments as Base moves $565B in stablecoins
Stablecoin activity is becoming a contest over which blockchains move the most tokenized dollars. Visa Onchain Analytics showed th...

Elon Musk Grok AI Predicts Incredible XRP Price Target by End of 2026
Elon Musk Grok AI just published what might be the most partnership-heavy XRP price prediction in this entire series. The model pr...

Bitcoin price rebounds to $63K as leverage returns creating short term volatility risk
Bitcoin's rebound has cleared the first test: price recovered. The harder one starts now: proving buyers remain after the squeeze....