BNB Price Targeting $600: Can It Reclaim This Milestone?
BNB price is holding the $565 support zone. The price is now consolidating and might aim for more gains above $590 in the near term. BNB price started a decent upward move from the $565 support zone. The price is now tra...

BNB price is holding the $565 support zone. The price is now consolidating and might aim for more gains above $590 in the near term.
- BNB price started a decent upward move from the $565 support zone.
- The price is now trading above $580 and the 100-hourly simple moving average.
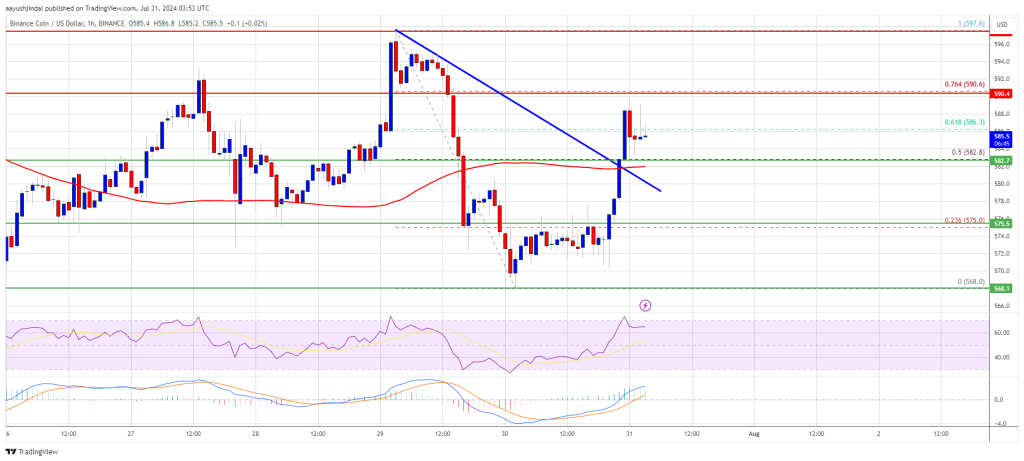
- There was a break above a key bearish trend line with resistance at $582 on the hourly chart of the BNB/USD pair (data source from Binance).
- The pair could extend its increase if it clears the $590 resistance in the near term.
In the past few days, BNB price saw a decent upward move from the $565 support zone, like Ethereum and Bitcoin. The price was able to climb above the $572 and $580 resistance levels.
It even cleared the $582 resistance. The current wave surpassed the 50% Fib retracement level of the downward move from the $597 swing high to the $568 low. Besides, there was a break above a key bearish trend line with resistance at $582 on the hourly chart of the BNB/USD pair.
The price is now trading above $582 and the 100-hourly simple moving average. It is now consolidating near the 61.8% Fib retracement level of the downward move from the $597 swing high to the $568 low.
On the upside, the price could face resistance near the $588 level. The next resistance sits near the $590 level. A clear move above the $590 zone could send the price higher. In the stated case, BNB price could test $600. A close above the $600 resistance might set the pace for a larger increase toward the $620 resistance. Any more gains might call for a test of the $632 level in the near term.
Are Dips Limited?If BNB fails to clear the $590 resistance, it could start a downside correction. Initial support on the downside is near the $582 level or the 100-hourly simple moving average.
The next major support is near the $575 level. The main support sits at $565. If there is a downside break below the $565 support, the price could drop toward the $550 support. Any more losses could initiate a larger decline toward the $532 level.
Technical Indicators
Hourly MACD – The MACD for BNB/USD is gaining pace in the bullish zone.
Hourly RSI (Relative Strength Index) – The RSI for BNB/USD is currently above the 50 level.
Major Support Levels – $582 and $575.
Major Resistance Levels – $590 and $600.
Original source
Read on NewsBTCRelated market context

Standard Chartered Says Bitcoin Bottomed Near $59,000 As Crypto Winter Ends
TL;DR Standard Chartered’s Geoffrey Kendrick reportedly says Bitcoin’s $59,000 area marked the cycle bottom. The note cites SpaceX...

Ripple chases AI’s machine economy as XRPL stablecoins near $1 billion
Stablecoin liquidity on the XRP Ledger (XRPL) has nearly doubled over the past month, putting the network within reach of a $1 bil...

Elon Musk SpaceX AI Predicts Incredible Bitcoin Price For Next 30 Days
Here is the thing about capitulation calls. They only sound smart in hindsight. Right now, with Bitcoin price scraping along the l...

Bitcoin rises above $64,000 after Pakistan prime minister says Iran peace deal is near
Bitcoin traded above $64,000 on Saturday, supported by its strongest ETF inflows in a month and growing optimism around geopolitic...

Bitcoin price faces new risk as big buyers lose conviction
Bitcoin’s largest buyers are no longer behaving like a reliable backstop for the largest cryptocurrency. The exchange-traded funds...

XRP Price Prediction: Japan XRP ETF Listing is Getting Closer
Japan just handed XRP bulls a major regulatory tailwind. XRP price is retesting a congestion zone, and the prediction could turn b...