Dogecoin Back At The Triangle Tip: Historical Trends Point To What Comes Next
Crypto analyst Trader Tardigrade is pointing to a setup that could define Dogecoin’s next major move. The Dogecoin monthly candlestick chart, which stretches back to 2014, shows a pattern that has played out with remarka...
Archive context
Older archive item. Useful for background and entity history, but not a fresh market-moving signal.
Crypto analyst Trader Tardigrade is pointing to a setup that could define Dogecoin’s next major move. The Dogecoin monthly candlestick chart, which stretches back to 2014, shows a pattern that has played out with remarkable consistency, almost mechanical in nature.
According to that structure, Dogecoin is now sitting right at the level where previous price explosions have been triggered.
A Pattern That Has Played Out Twice BeforeDogecoin is still trading below $0.10 into the last week of April, languishing well below its cycle peak of $0.48 and largely ignored by many crypto investors. But for Trader Tardigrade, that lack of action may be precisely the point.
The structure at the center of Trader Tardigrade’s analysis is a descending triangle that appears to form on Dogecoin’s monthly chart at the end of every major market cycle. Looking at the monthly chart below, Dogecoin initially broke above this triangle formation in 2024. However, the meme coin has been on a price correction path since late 2024, and is now at the point of retesting the apex of the triangle.
Interestingly, similar retests of the apex of the triangle, which is its tightest, most compressed point, have always indicated the precise moment before an explosive move to the upside.
Back in 2017, Dogecoin compressed into the tip of such a formation and then surged in what became its first significant bull run. The pattern repeated in 2020, when the DOGE price once again coiled into the triangle’s apex before exploding into the historic 2021 rally that took the meme coin to a peak of $0.73.
Now, in 2026, Trader Tardigrade is pointing to a third convergence. The monthly chart shows price action once again compressing and retesting the triangle’s tip.
Dogecoin’s Price Chart. Source: @TATrader_Alan On X
Dogecoin Price ProjectionAccording to Trader Tardigrade, when Dogecoin comes back to the tip of the triangle, it doesn’t ask permission. The prediction is a bounce from the triangle’s apex that pushes the Dogecoin price into new price territories. Notably, the analyst’s projection sees Dogecoin going as high as $2.4 if the bounce plays out in full.
Although the pattern itself is clear, the broader market environment will likely play a key role in determining how this setup unfolds. This is because Dogecoin’s previous rallies coincided with strong bullish phases across the crypto market.
The crypto market is more complex right now, and the fundamental landscape around Dogecoin in 2026 is materially different from what existed in prior cycles.
Bitcoin, for one, needs to stabilize into a full bullish momentum first. The leading cryptocurrency has been attempting to stabilize above $78,000, while capital flows into the industry have picked up in recent days.
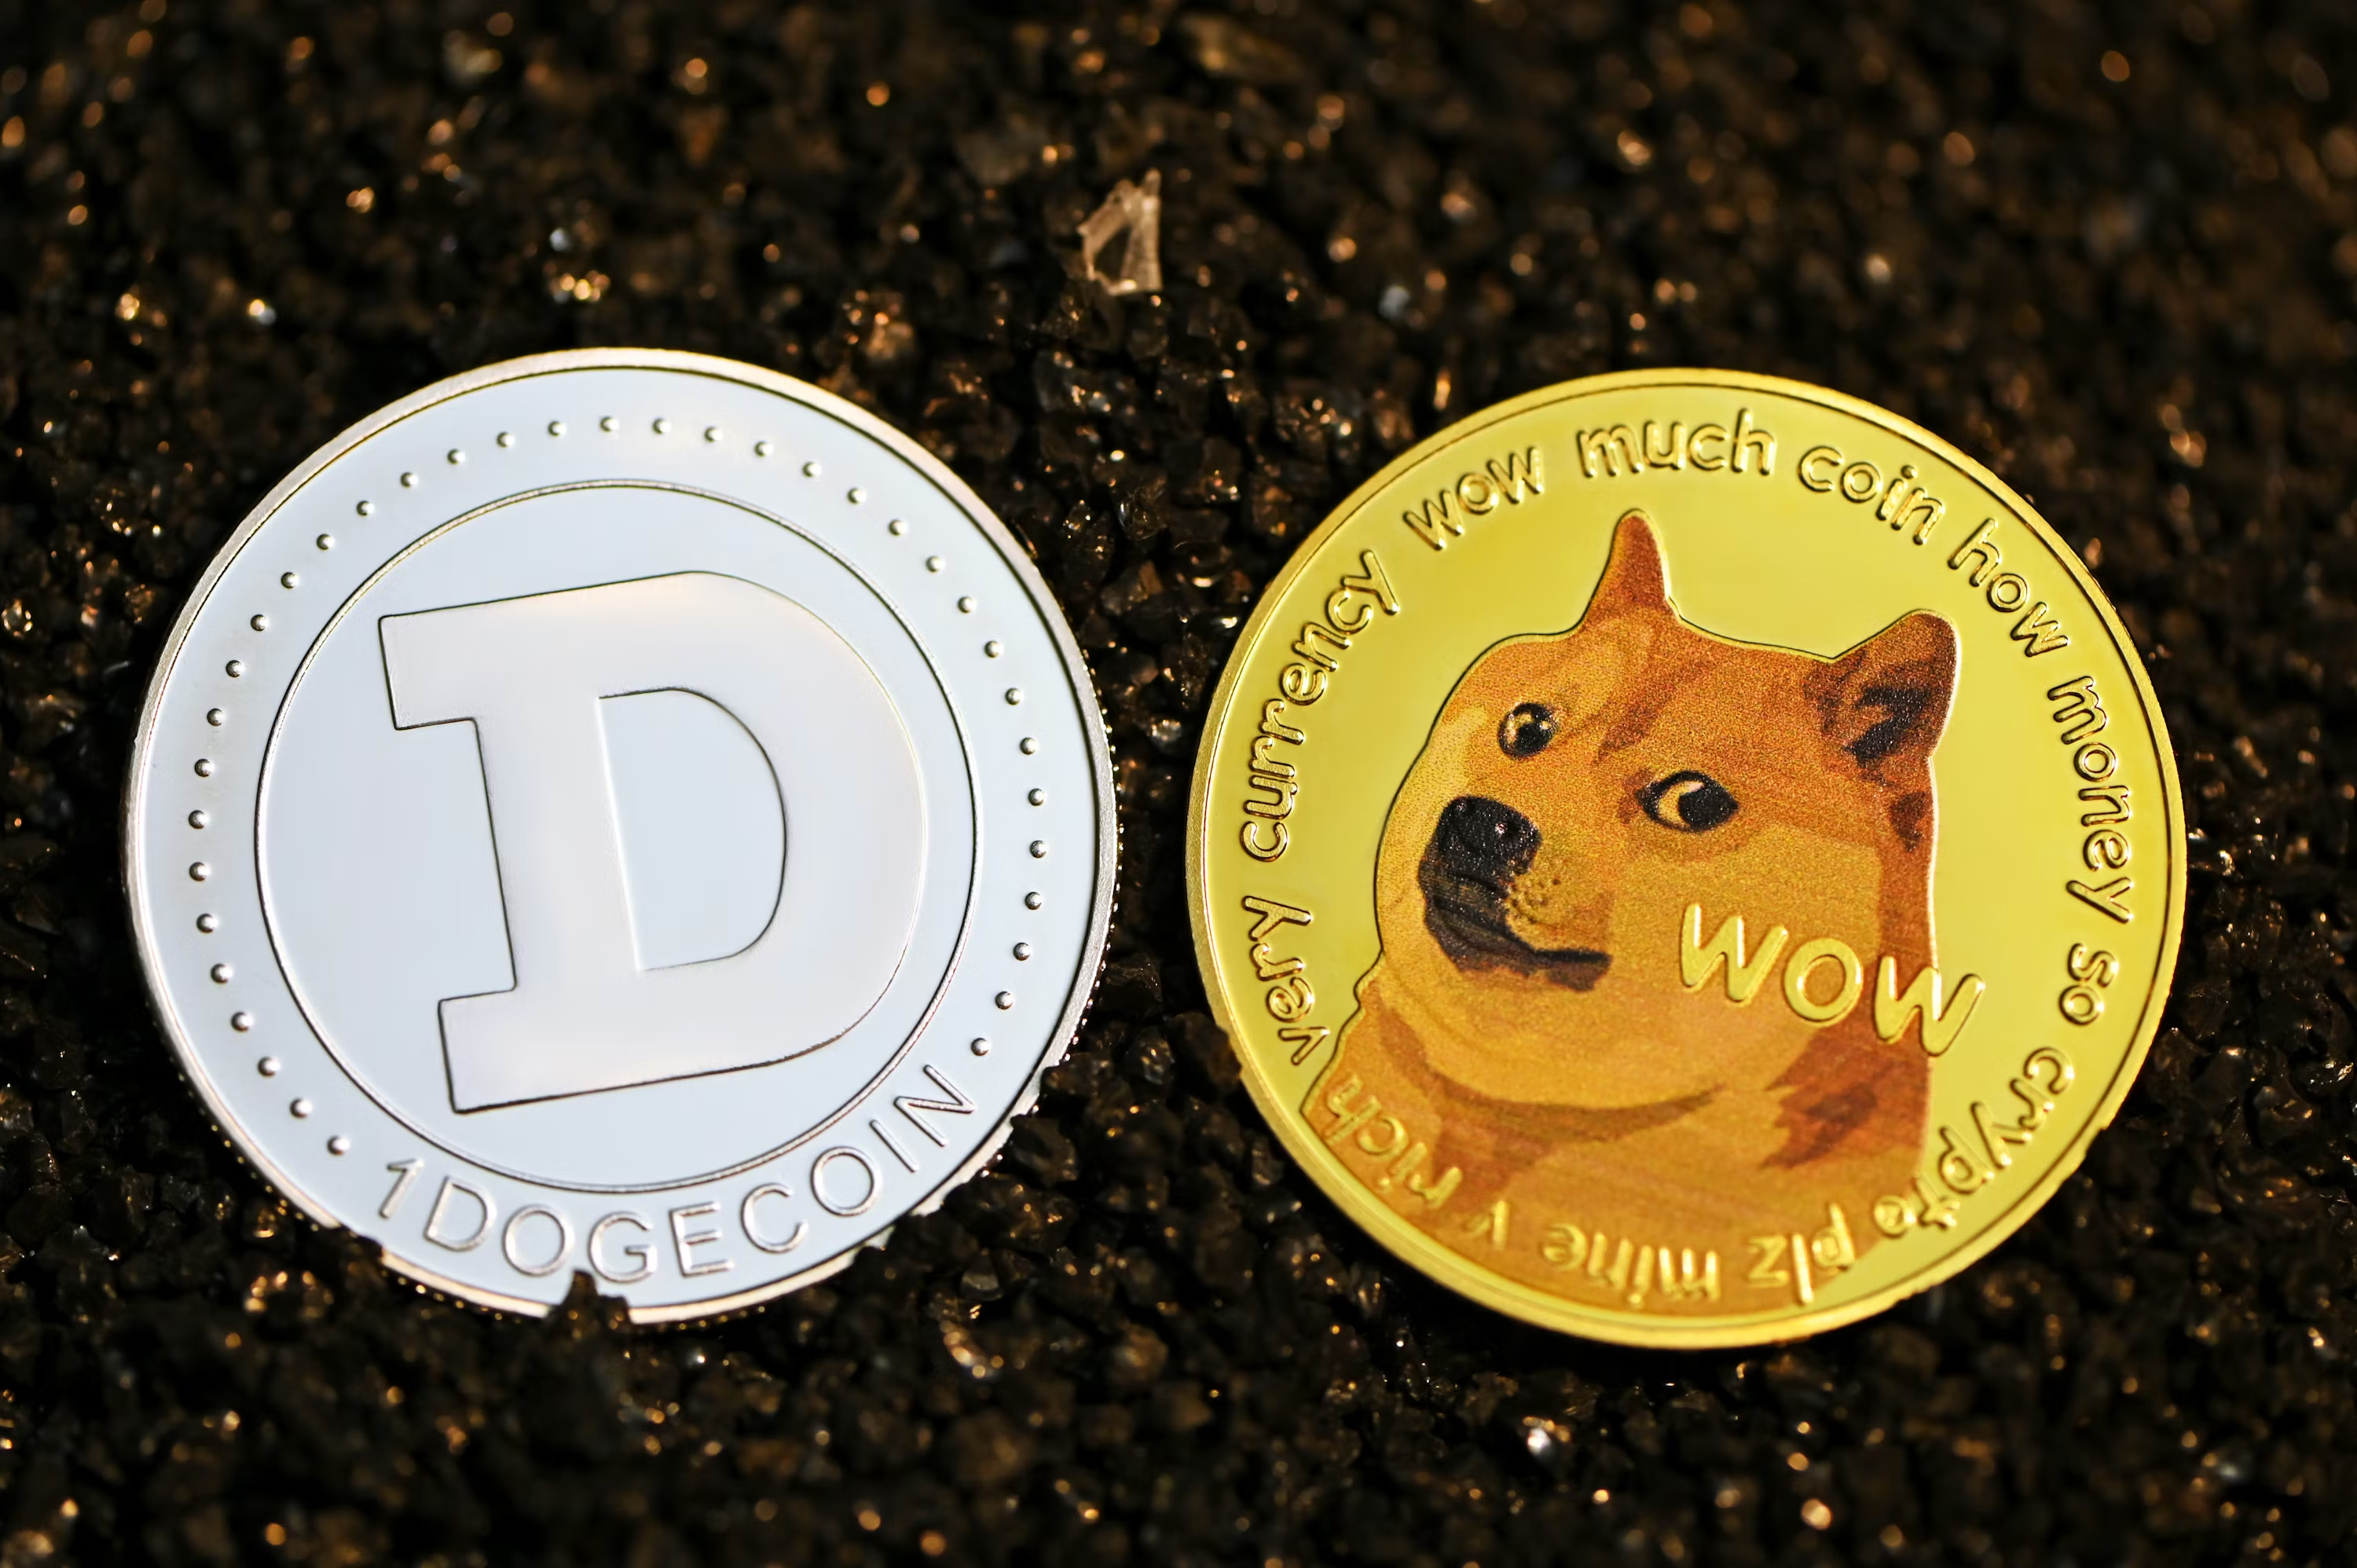
Featured image from Unsplash, chart from TradingView
Why this matters
Dogecoin is showing up inside the Memecoins theme, so this story is worth tracking for follow-through rather than treating it as a one-off headline.
Original source
Read on NewsBTCRelated market context

Bitwise Dogecoin ETF Reaches Scheduled Liquidation As Holders Face Cash Redemption
TL;DR: Bitwise’s BWOW Dogecoin ETF reached its announced October 22 liquidation distribution date, with remaining shareholders due...

Dogecoin Labs Brings MyDoge And DogeOS Together In Commercial Reset
TL;DR: Dogecoin Labs is bringing wallet, payment and application teams into one organization. House of Doge says it will contribut...

Hyperliquid Strategies expands stock buyback program to $100M as PURR shares fall over 30%
Hyperliquid Strategies increases its stock buyback authorization to $100 million as PURR shares decline over 30% and HYPE falls mo...

Bitcoin Steadies Near $81,700 as Robinhood Traders Bet on Bitcoin and Gold, and Bitcoin Core Rewrites Its Security Playbook
Bitcoin trades near $81,700 as Robinhood sees surging bitcoin and gold prediction markets, Bitcoin Core ends its bug embargo, and...
Dune Adds Real-Time Spot And Perpetual Trade Feeds Across On-Chain Markets
TL;DR: Dune has launched normalized real-time feeds for spot and perpetual DEX trades, designed to help institutional desks compar...

Bitcoin steadies near $81,700 as memecoins lead altcoin rebound
Bitcoin recovered to around $81,700 as memecoins climbed 2.9% and pepe jumped 13%. ETF flows turned negative ahead of the Fed meet...