Dogecoin Breakout Fever: Is The 300% Moonshot Back?
Dogecoin is pressing on a familiar technical hinge on the weekly chart. In a setup highlighted by crypto analyst Cantonese Cat (@cantonmeow), DOGE has completed a third multi-month descending trendline test in as many cy...
Archive context
Older archive item. Useful for background and entity history, but not a fresh market-moving signal.

Dogecoin is pressing on a familiar technical hinge on the weekly chart. In a setup highlighted by crypto analyst Cantonese Cat (@cantonmeow), DOGE has completed a third multi-month descending trendline test in as many cycles, with price now hovering just below a quarter dollar after a brief breakout and early retest.
On the 1-week timeframe, the chart shows three distinct bear-market trendlines and subsequent expansions. The first downtrend, drawn from late-2022 swing highs through mid-2023 lower highs, was broken in September 2023. From that breakout point, DOGE advanced roughly 230%, marking the cycle’s initial expansion phase.
The second sequence repeated across late-2023 into 2024: an April–June 2024 distribution created a fresh descending line that capped price through October 2024, when a weekly close through the line triggered the next impulse. From that October 2024 breakout, the advance extended about 350% into the late-2024 peak.
Price action since the November–December 2024 high near $0.48 carved the third descending trendline. Over the past several candles, DOGE pushed through that line, then slipped back toward it, producing a classic “return move” on reduced momentum. As of the chart’s timestamp (Sep. 29, 2025, 00:04 UTC), DOGE trades around $0.2369 on the weekly, a level that sits in the middle of this retest zone.
Golden Cross Or One More Dip For Dogecoin?Crypto analyst Cas Abbé (@cas_abbe) is closely monitoring the daily chart, where a golden cross between the 100-day SMA ($0.2192) and the 200-day EMA ($0.2199) is forming. Historically, such crossovers have signaled the beginning of extended bullish phases.
Abbé stressed the broader market impact of a Dogecoin rally, noting: “DOGE golden cross is approaching soon. This is one of the alts I’m paying very close attention to. The reason is very simple: When DOGE pumps, Altseason starts.” His key threshold is $0.33, a resistance level that has capped multiple rallies. A clean break above it could accelerate capital rotation into the broader altcoin market. “If DOGE manages to pump above $0.33, alts will go bonkers,” he noted.
Meanwhile, liquidity dynamics add nuance to the technical picture. Cryptoinsightuk (@Cryptoinsightuk) shared a liquidity heatmap indicating dense bids around $0.18, while supply concentrations above $0.30 form notable resistance zones. He explained his tactical approach: “Because of this I’ve closed my DOGE long slightly in the green and I’ve placed bids around $0.18.” This reflects a market structure where traders are positioning for downside liquidity sweeps before potential continuation higher.
Currently trading near $0.229, DOGE sits at the intersection of conflicting signals. On one side, the historical pattern of breakouts from descending trendlines, the imminent golden cross, and Abbé’s $0.33 breakout level argue for bullish continuation. On the other, liquidity maps suggest vulnerability to deeper retracements toward $0.20–0.18 before any sustained rally.
Why this matters
This altcoin story adds another data point to the current market tape and is useful when read alongside nearby source coverage.
Original source
Read on NewsBTCRelated market context

Dogecoin Foundation and House of Doge End Exclusive Brand Deal
House of Doge keeps limited investment-product rights, while a separate deal would exchange Such App assets for $4 million in Doge...

Bitcoin (BTC) Price Prediction: $74K Liquidity Gap Puts $80K Support to the Test
Meanwhile, data from Glassnode and Fasanara Digital show that traditional financial assets are capturing a growing share of deriva...
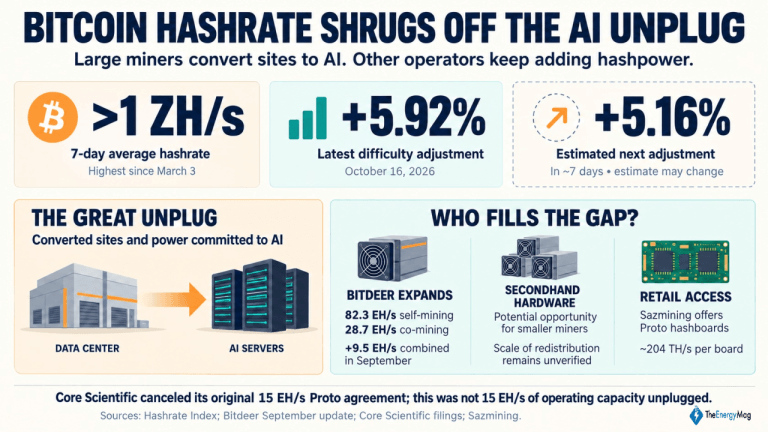
Miner Weekly: Bitcoin Hashrate Shrugs off the AI Unplug, Regaining 1 ZH/s Level
Big public miners are making room for artificial intelligence (AI). Bitcoin’s hashrate is climbing anyway. This article first appe...
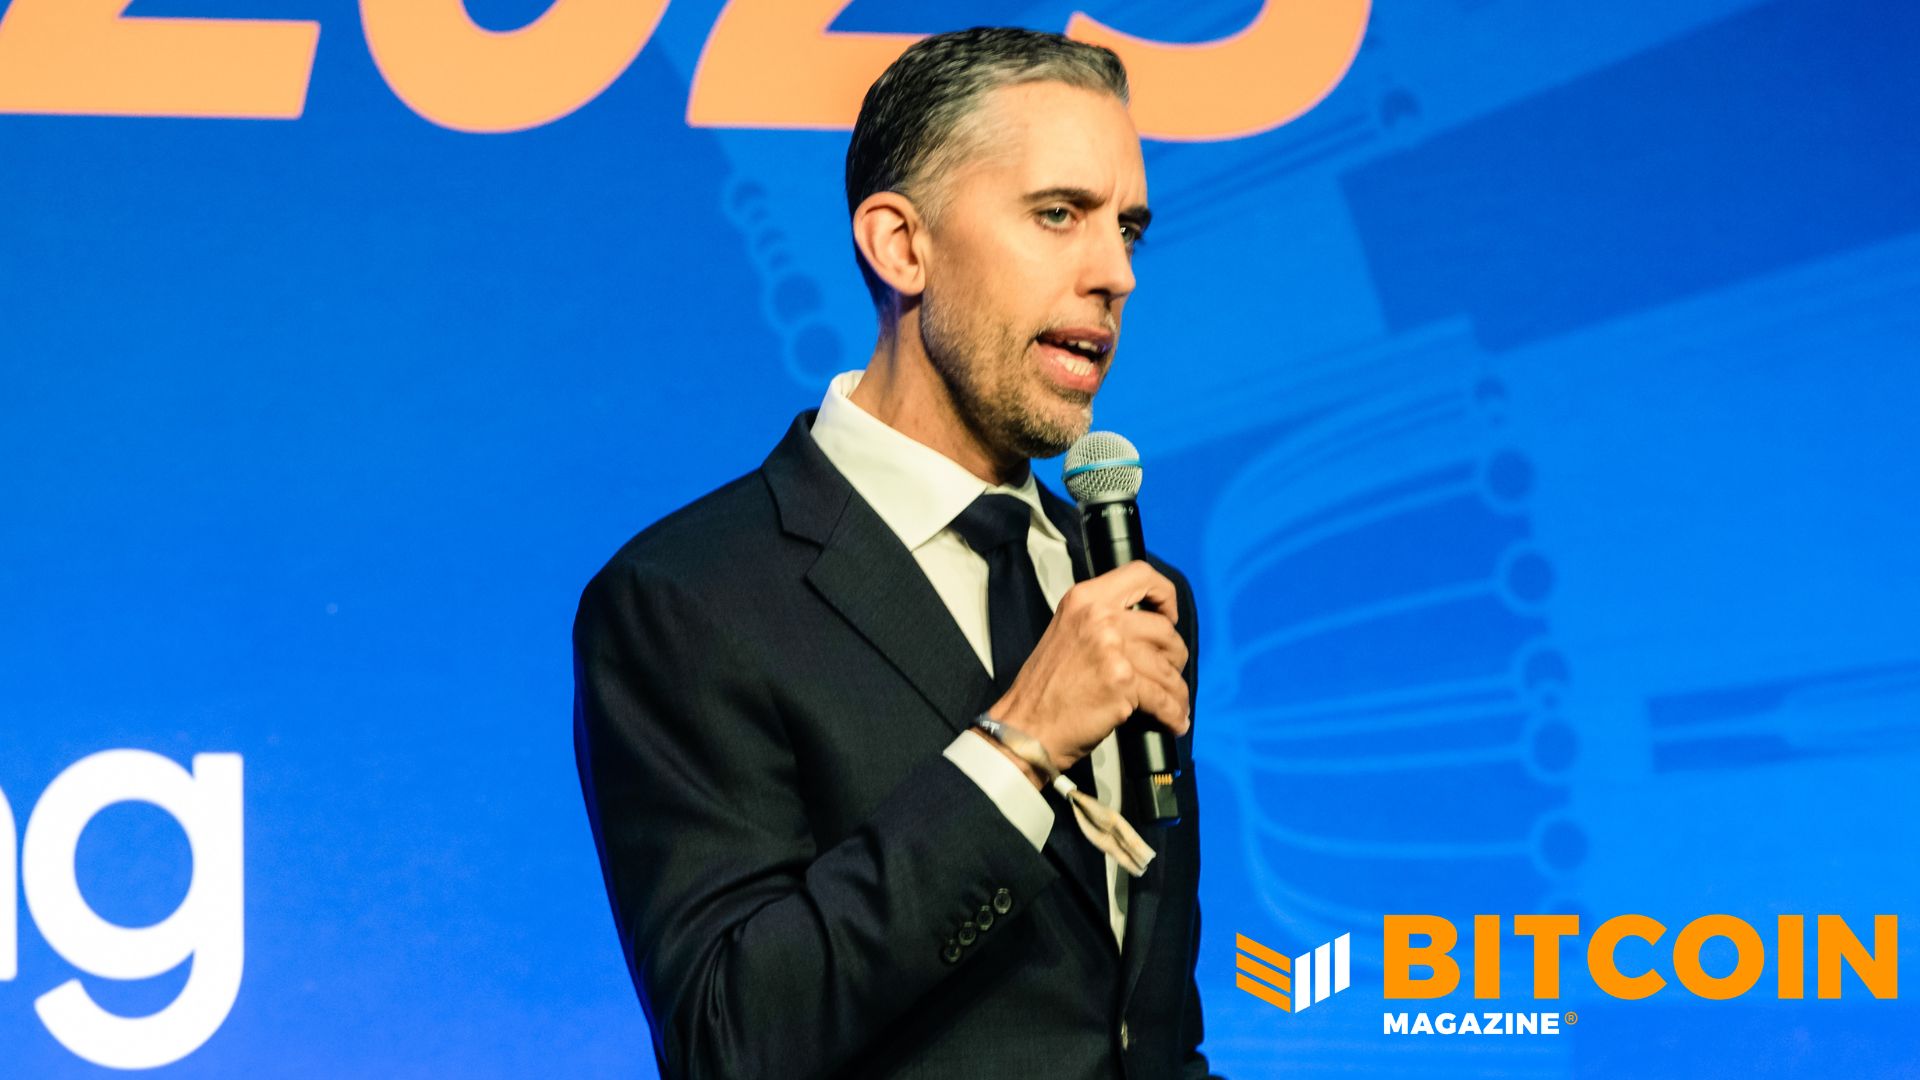
Strive Buys 6,182 Bitcoin For $511 Million, Lines Up $1 Billion ATM To Buy More
Bitcoin Magazine Strive Buys 6,182 Bitcoin For $511 Million, Lines Up $1 Billion ATM To Buy More Strive, Inc. (ASST) acquired 6,18...

Lido Puts Liquidity Buffers At The Center Of Ethereum ETP Yield Debate
An Ethereum investment product can advertise staking exposure without putting every unit of its ETH to work. Lido’s October 23 com...

Ripple And Arf Target The Short Funding Gap Behind Cross-Border Payments
A payment can move across a blockchain in seconds while the company delivering it remains short of cash for days. Ripple’s new arr...