XRP Price Trails Bitcoin – Can It Break Past The Hurdles Holding It Back?
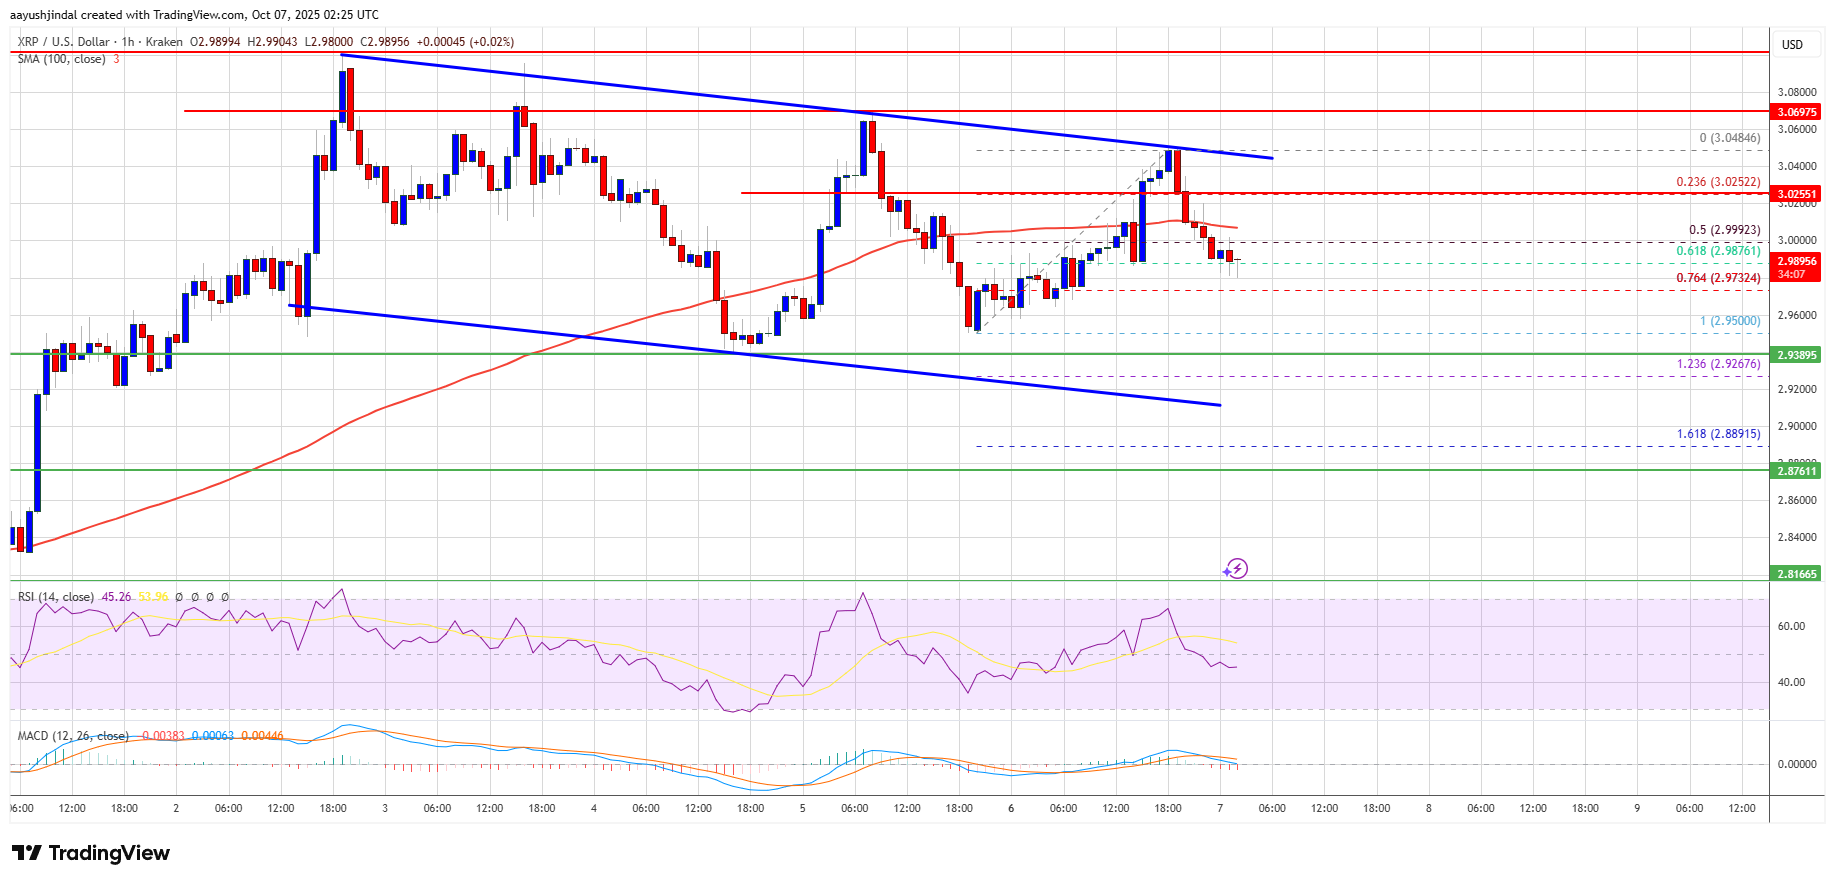
XRP price struggled to stay above $3.020 and $3.050. The price is now consolidating gains and might correct lower toward the $2.920 zone. XRP price is slowly moving lower below the $3.00 pivot zone. The price is now trad...
Archive context
Older archive item. Useful for background and entity history, but not a fresh market-moving signal.

XRP price struggled to stay above $3.020 and $3.050. The price is now consolidating gains and might correct lower toward the $2.920 zone.
- XRP price is slowly moving lower below the $3.00 pivot zone.
- The price is now trading below $3.00 and the 100-hourly Simple Moving Average.
- There is a key declining channel forming with resistance at $3.0450 on the hourly chart of the XRP/USD pair (data source from Kraken).
- The pair could start a fresh increase if it settles above $3.050.
XRP price started a decent increase after it settled above the $2.820 level, but it underperformed Bitcoin and Ethereum. The price was able to surpass the $2.90 and $2.950 resistance levels.
The price even climbed above $3.020 before the bears appeared. A high was formed at $3.098 and the price corrected some gains. The last swing low was formed at $2.950 before the price retested $3.050. The price is now moving lower below the 50% Fib retracement level of the recent wave from the $2.950 swing low to the $3.048 high.
The price is now trading below $3.00 and the 100-hourly Simple Moving Average. On the upside, the price might face resistance near the $3.020 level. The first major resistance is near the $3.050 level. There is also a key declining channel forming with resistance at $3.0450 on the hourly chart of the XRP/USD pair.
A clear move above the $3.050 resistance might send the price toward the $3.080 resistance. Any more gains might send the price toward the $3.120 resistance. The next major hurdle for the bulls might be near $3.150.
Another Decline?If XRP fails to clear the $3.030 resistance zone, it could start a fresh decline. Initial support on the downside is near the $2.9720 level or the 76.4% Fib retracement level of the recent wave from the $2.950 swing low to the $3.048 high. The next major support is near the $2.920 level.
If there is a downside break and a close below the $2.920 level, the price might continue to decline toward $2.850. The next major support sits near the $2.80 zone, below which the price could continue lower toward $2.720.
Technical Indicators
Hourly MACD – The MACD for XRP/USD is now losing pace in the bullish zone.
Hourly RSI (Relative Strength Index) – The RSI for XRP/USD is now below the 50 level.
Major Support Levels – $2.950 and $2.920.
Major Resistance Levels – $3.020 and $3.050.
Why this matters
This altcoin story adds another data point to the current market tape and is useful when read alongside nearby source coverage.
Original source
Read on NewsBTCRelated market context

Bitcoin Price Prediction: BTC Falls Below $64K as Fed Rate-Hike Fears Intensify
According to Brave New Coin data, Bitcoin Price dropped as much as 2.3% to around $63,368 during early Asian trading, its lowest l...

Bitcoin Price Prediction: BTC Slides in Asian Hours, Moving in Tandem with Korean KOSPI
Bitcoin price is trading near $63,480 as selling accelerated during the Asian session, sending BTC prediction slipped into a beari...

Dogecoin (DOGE) Price Prediction: Can Rare TD Sequential Buy Signals Trigger a Historic Reversal Toward $0.16?
The signals have emerged as Dogecoin trades near $0.073, close to a long-term technical area that has attracted attention from mar...

South Korea’s Stock Market Triggered 8th Circuit Breaker of 2026: Bitcoin Liquidated 3 Times Near $64,000
Bitcoin News: BTC price is trading at $63,582 on July 28, down 2.12% in the past 24 hours, and the level that keeps breaking trade...

XRP Price Prediction: Fed Rate Decision and Ripple ETF Flow
XRP prediction remains mixed as its price trades near $1.5, down about 5% over the past 24 hours, while traders await the Federal...

Ethereum Price in Limbo as Bitmine Inches Away From Its 5% Supply Target
Ethereum price is trading at $1,880, down 3.3% on the day after slipping from recent highs. The market remains caught between stea...