XRP’s Toughest Bull Run Could Lead To Big Gains, Analyst Claims
Bitcoin’s smaller cousin, XRP, has drawn fresh bullish bets after it held above the $3 mark in July. According to trading charts and public commentary, the token first pierced $3 in January 2025 — its highest point in se...
Archive context
Older archive item. Useful for background and entity history, but not a fresh market-moving signal.
Bitcoin’s smaller cousin, XRP, has drawn fresh bullish bets after it held above the $3 mark in July. According to trading charts and public commentary, the token first pierced $3 in January 2025 — its highest point in seven years — then pulled back before reclaiming that level in mid-July.
The comeback has some analysts reading the move as a change in market structure, and price sits near $3.12 as momentum checks continue.
Trendline Breakouts And Support FlipAccording to analyst Steph, a breakout above a long-running descending trendline on the weekly XRP chart is what matters now.
Steph points to the flip of $3 from resistance into support as a classic technical cue. He used historical weekly charts to argue that past breakouts from similar trendlines often led to strong rallies, and he highlighted that pattern going back to 2022 when price action began to shift more visibly.
This is the hardest #XRP bull market ever.
Congratulations if you’re still here.
We will get rich! pic.twitter.com/cLltUs7MQj
— STEPH IS CRYPTO (@Steph_iscrypto) August 12, 2025
A Pattern Seen Several Times Since 2022Reports have traced the same setup across multiple cycles. After the Terra collapse in May 2022, XRP fell and formed a descending trendline that broke in September 2022, sending price to a high near $0.55.
Later, a new trendline formed and then broke around the SEC vs. Ripple ruling in July 2023, which preceded a move toward $0.94.
The most recent big run took XRP to about $3.4 in January 2025, after a breakout following the November 2024 US elections. Those episodes form the backbone of the “repeat pattern” case.
Analyst Targets And Differing CallsSteph projects a potential rise to $14 from roughly $3.12 now, which would equal about a 340% gain. According to his messaging, some traders who sold early took profits, while others who held could see larger returns if the thesis plays out.
Based on reports, some commentators have voiced similar targets, saying when XRP traded near $2, that the token was poised for a major breakout and pointed to Fibonacci levels toward $14, while others put a $14 minimum target on the table last March.
What To Watch Going ForwardVolume on any push above recent highs will tell the story. Keep an eye on whether $3 stays as support and whether the weekly breakout holds as price moves higher.
Also watch how long consolidation around $2 lasted — more than five months — because long flat bases can precede sharp moves if buyers return in force. Derivatives flows and where large holders place sell orders will matter too.
Featured image from Unsplash, chart from TradingView
Why this matters
This altcoin story adds another data point to the current market tape and is useful when read alongside nearby source coverage.
Original source
Read on NewsBTCRelated market context

XRP Price Prediction: XRP Faces Critical Resistance Near $1.17 Despite Ripple Securing Landmark EU License
While the company secured a full MiCA license that expands its operations across the European Economic Area, market indicators sug...

Bitcoin (BTC) Price Prediction: BTC Holds $63K Support—Can Rising Active Addresses Offset Bearish Technical Signals?
Although the BTC price has remained near a key support zone, recent chart signals and Strategy’s sale of a portion of its Bitcoin...

Strategy Sells 3,588 Bitcoin to Fund Dividends as Saylor’s Treasury Model Meets Its First Real Test
Strategy (MSTR), the Michael Saylor–led company that turned corporate bitcoin accumulation into a Wall Street phenomenon, disclose...
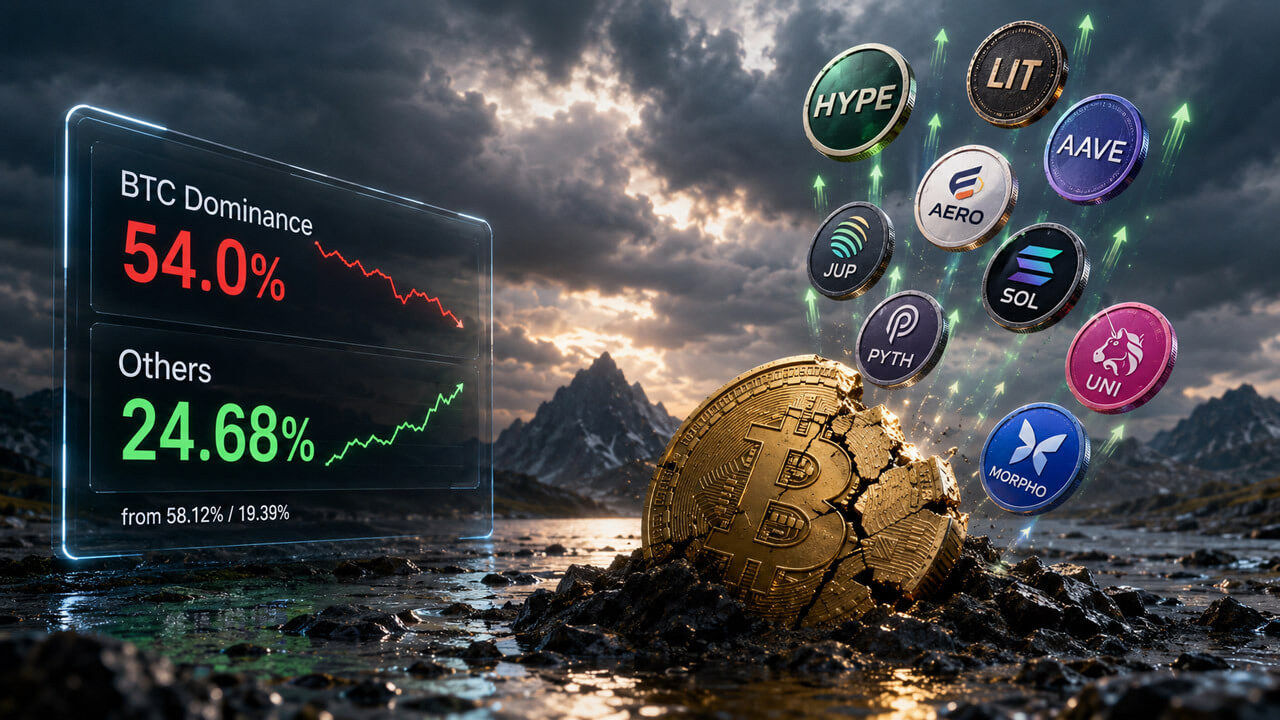
Bitcoin dominance hits one-month low as altcoin winners start breaking away
Bitcoin's dominance dropped to a one-month low of 54%, down from 58.12%, according to CoinGecko's dominance table. Over the same s...

Sam Altman ChatGPT AI Predicts Insane Bitcoin Price by 2026
Sam Altman ChatGPT AI just circled November on the calendar and put a number next to Bitcoin Price Prediction. The model predicts...

Elon Musk Grok AI Predicts Incredible XRP Price Target by End of 2026
Elon Musk Grok AI just published what might be the most partnership-heavy XRP price prediction in this entire series. The model pr...