Bitcoin Could Enter Freefall If This Level Cracks: Analyst
Bitcoin has bounced back from the $70,000 zone multiple times in 2026, but analysts are warning that the next test of that level could end differently. A Line That Has Held Since 2017 The lower boundary of a rising wedge...
Archive context
Older archive item. Useful for background and entity history, but not a fresh market-moving signal.

Bitcoin has bounced back from the $70,000 zone multiple times in 2026, but analysts are warning that the next test of that level could end differently.
A Line That Has Held Since 2017The lower boundary of a rising wedge pattern — a trendline that first appeared as support in mid-2017 — has absorbed several sharp drops over the years.
Bitcoin touched it during the FTX-driven crash of November 2022, when prices fell to $15,400, and the line held. It held again three times in the opening months of 2026, at $60,000 in February, then at $64,900 and $65,000 in March and April.
Related Reading: Bitcoin’s 4-Year Rhythm Is Still Playing Out, Says Crypto CEO
Crypto market commentator MichaelXBT brought renewed attention to the pattern after Bitcoin dropped below $74,000 for the first time in over a month.
Based on his chart analysis, the support trendline now sits around the $70,000 mark, and a confirmed break below it would be historically significant.
Bitcoin 10-Year Wedge Support: $70k
If that level breaks, bears will be handsomely rewarded.
It will ignite the largest red weekly candle Bitcoin has seen in years.
History will be made. pic.twitter.com/0HqImRTD4s
— Crypto Michael (@MichaelXBT) May 27, 2026
“If that level breaks, bears will be handsomely rewarded,” he said.
What A Break Could MeanMichaelXBT says a breakdown would trigger the largest weekly red candle Bitcoin has seen in years. He stopped short of naming a price target or estimating how far a drop might extend, but his view is that the event would be a notable moment in the asset’s history.
The wedge pattern at the center of his analysis is formed by two converging trendlines moving upward, with the lower one rising faster than the upper. When prices break below the lower line, the pattern is generally read as a sign that bullish momentum has run out.
Not Everyone Sees Collapse ComingMichaël van de Poppe, a veteran crypto market analyst, pushed back on the more bearish readings. He described what markets are going through as a standard end-of-month correction, driven largely by asset managers rebalancing their portfolios.
Bitcoin faced rejection at $77,000, he said, and the pullback that followed fits a familiar pattern rather than a breakdown signal.
Van de Poppe acknowledged that if Bitcoin fails to hold his key support area, prices could slide toward the lower range of the $60,000s. But he was direct in saying current weakness alone is not enough to call a new low.
Featured image from Pexels, chart from TradingView
Why this matters
Bitcoin is a tracked market entity in the DigitalMoneyBox archive, making this useful context for readers monitoring repeated mentions and follow-up coverage.
Original source
Read on NewsBTCRelated market context

Ethereum (ETH) Price Prediction: $2,400 Support Holds as Bulls Eye $2,570 and $3,000
The latest recovery has pushed Ethereum price back towards $2,446 after buyers defended the important $2,400 support region. ETH p...
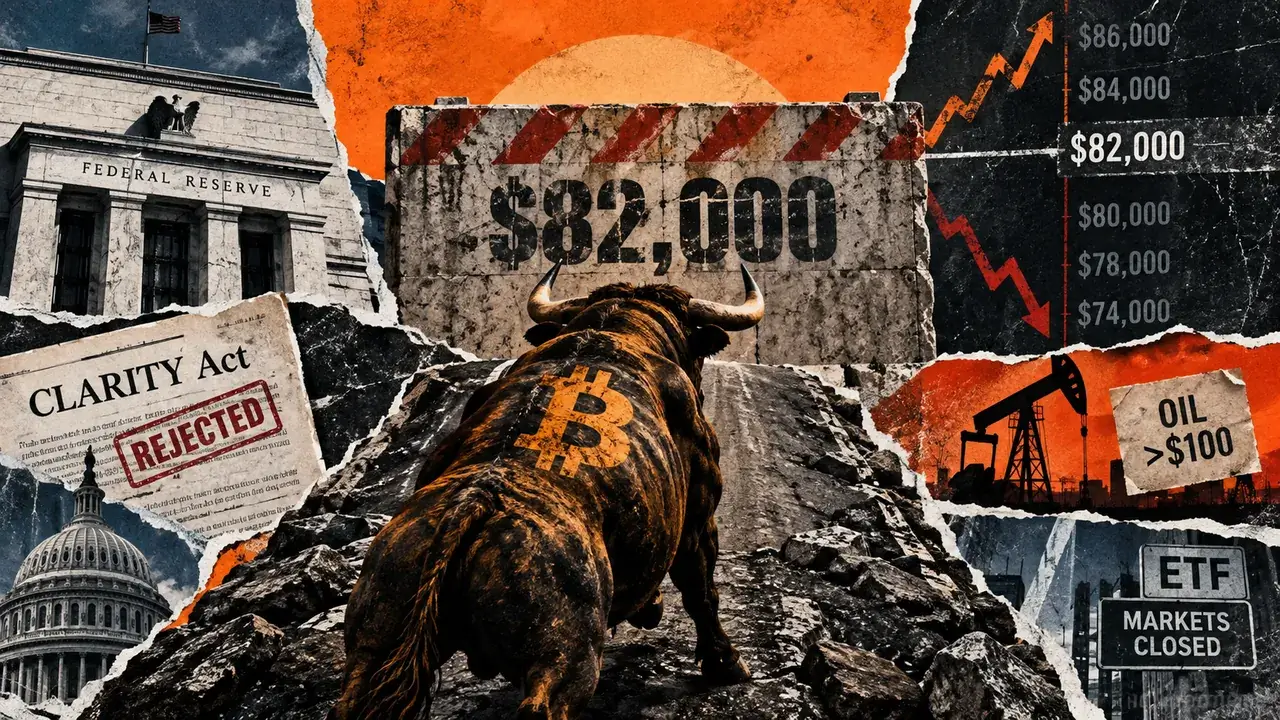
Bitcoin survived the Fed and CLARITY, and now faces the next major test at $82,000 this weekend
Bitcoin hit an intraday high of $81,400 on Friday, approaching the low-$82,000 zone that has capped every recovery attempt since l...

Bitcoin rises 6% as lower oil prices and SEC decision boost market
Bitcoin's rise highlights the impact of regulatory shifts and market dynamics on digital assets, signaling potential volatility ah...

Google Gemini AI Predicts an Explosive End to 2026 for XRP
When prompted, Google Gemini AI predicts that under a full bull market structure between now and 2027, XRP could surge as high as...
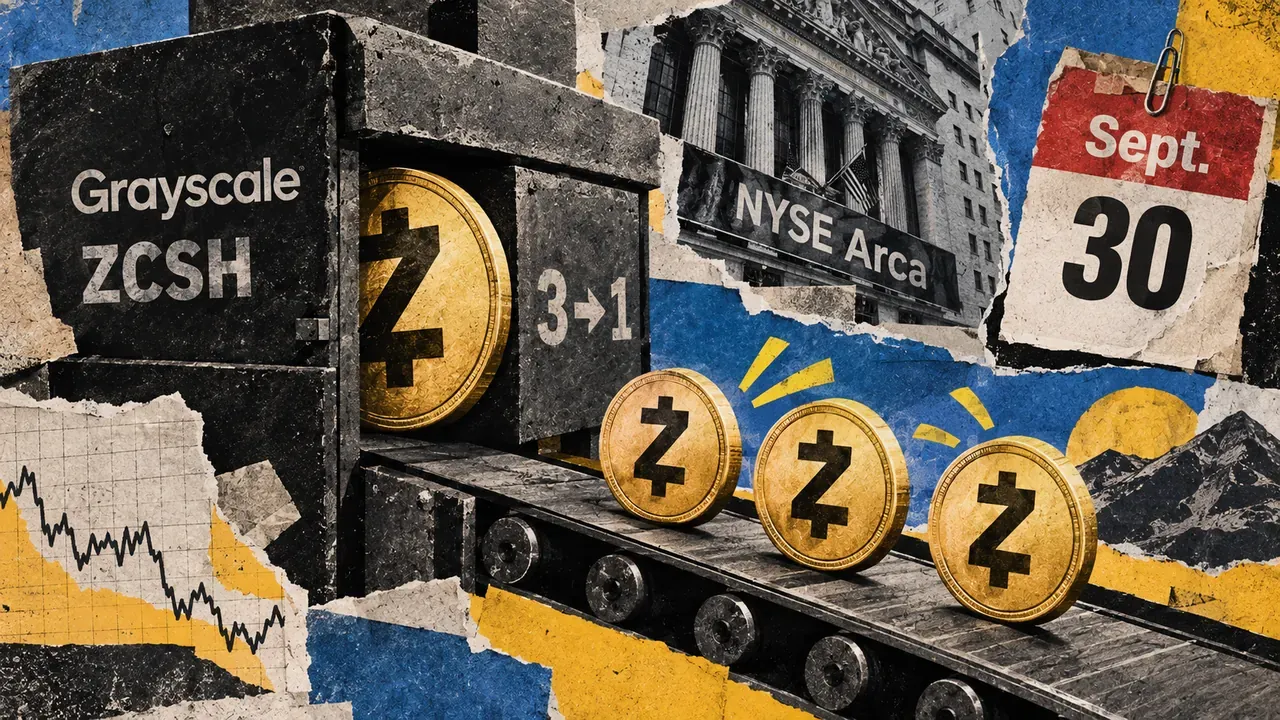
ZEC’s 100% rally above $1500 sends Grayscale’s Zcash ETF within $85 million of $1 billion
Grayscale’s Zcash ETF is closing in on $1 billion in assets less than a month after its Wall Street debut. The fund, which trades...

XRP Price Prediction: Ripple Prints Most Bullish RSI Ratio Since Covid
XRP price trades at $1.32, clawing back ground after a brutal two-week stretch that saw it shed its value and prediction from the...