Bitcoin Direction Still Unclear: Analyst Says Watch These Key Charts
An analyst has revealed the key Bitcoin charts that could be to keep an eye on while Bitcoin is slowly making recovery from its latest crash. These Bitcoin Charts Could Be Ones To Watch In a shock to the market, Bitcoin...
Archive context
Older archive item. Useful for background and entity history, but not a fresh market-moving signal.

An analyst has revealed the key Bitcoin charts that could be to keep an eye on while Bitcoin is slowly making recovery from its latest crash.
These Bitcoin Charts Could Be Ones To WatchIn a shock to the market, Bitcoin ended last week with a steep crash, falling from above $122,000 to below $110,000. The coin managed to make some recovery on Sunday, and that rebound has held so far into Monday.
However, while BTC appears to be rebuilding its structure, its direction remains unclear, as noted by CryptoQuant community analyst Maartunn in an X thread. Maartunn has shared a few key charts that could determine whether the recovery will hold or fade.
First, the analyst has revealed a chart that points out a similarity between the recent Bitcoin price action and the November 2021 bull market top.
As displayed in the above graph, BTC broke above its weekly resistance with the recent price rally, but immediately fell below the line after the crash. A similar failed breakout also took place back in November 2021. According to Maartunn, such a trend typically signals exhaustion.
On-chain data also suggests the cryptocurrency is currently trapped below a notable resistance level, as the chart for the UPRD shows.
The UTXO Realized Price Distribution (URPD) here is an indicator that tells us about the amount of Bitcoin that was last purchased/transferred at the various price levels that the asset has visited in its history.
From the metric’s chart, it’s visible that a significant amount of supply has its cost basis between $117,500 to $120,000. The holders of these coins would naturally be underwater right now, so there is a chance that if BTC recovers to their break-even level, they might panic sell, fearing going into losses again.
Given the scale of the supply involved, selling pressure of this kind could be notable on a retest of the range, potentially making it a major resistance barrier for the asset.
A support level that could be key is the average cost basis or Realized Price of the short-term holders (STHs).
The line has historically helped the asset find a rebound during bullish trends, with three instances of the trend occurring within the last six weeks alone. The analyst has warned, however, that conviction among the cohort is fading.
The Market Value to Realized Value (MVRV) Ratio suggests profitability among the Bitcoin STHs has been following a long-term decline, with the boundary level of 1 again being retested.
“If this level breaks, expect downside. If it holds, it confirms demand — but manage risk accordingly!” noted Maartunn in the thread.
BTC PriceAt the time of writing, Bitcoin is floating around $114,100, down over 8% in the last seven days.
Why this matters
This bitcoin story adds another data point to the current market tape and is useful when read alongside nearby source coverage.
Original source
Read on NewsBTCRelated market context

XRP Price Today: XRP Hits $1.60 as Heavy Whale Accumulation Points to a $2 Rally and Beyond
The XRP price reached $1.6060 on September 23 after opening near $1.5808, according to historical market data. The token subsequen...

Bitcoin Recoils Below $86,000: Is Bitcoin Price Prediction Still Shooting For $90,000?
Bitcoin Price Prediction: Bitcoin (BTC) trades at $85,954, down a modest 0.3% on the day, holding the upper band of a rebound that...

Solana Price Prediction: Golden Cross and $2.97B Open Interest Put $400 Target in Focus
Solana price is trading near $117.38 after recovering strongly from its recent lows. With SOL now testing the crucial $118–$120 re...
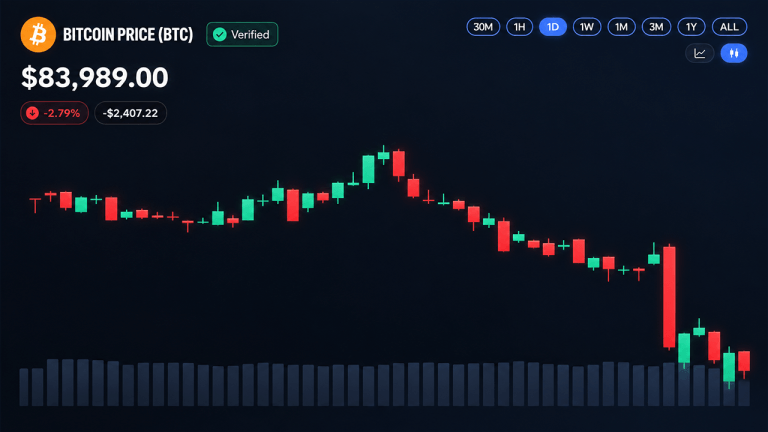
Bitcoin Price Plunges Below $84K as Rally Snaps
Bitcoin’s rally abruptly ended as its price dropped below $84,000, reaching an intraday low of $83,508 shortly after failing to ho...

ETH USD Loses Ground as Ethereum Price Analysis Remains Targeting $3,000 This Week
Ethereum Price Prediction, September 23: Ethereum (ETH) trades at $2,735, down a marginal 0.61% over the past 24 hours, a pause, n...

Can Ripple Crack $1.80? XRP Price Prediction Says This Week
XRP Price Prediction: Ripple (XRP) trades at $1.59 as of this writing, up 1.6% on the day, with a 24-hour range spanning $1.5577 t...