Bitcoin Inflows In Last 1.5 Years Surpassed First 15 Years Combined: Data
On-chain data shows inflows into Bitcoin have recently been so large that they outweigh the cumulative capital that entered BTC in its first 15 years. Bitcoin Realized Cap Shows Acceleration In Inflows Recently In a new...
Archive context
Older archive item. Useful for background and entity history, but not a fresh market-moving signal.

On-chain data shows inflows into Bitcoin have recently been so large that they outweigh the cumulative capital that entered BTC in its first 15 years.
Bitcoin Realized Cap Shows Acceleration In Inflows RecentlyIn a new post on X, CryptoQuant founder and CEO Ki Young Ju has shared the trend in the Realized Cap of Bitcoin over its entire history. The “Realized Cap” here refers to an on-chain indicator that measures, in short, the total amount of capital that the investors as a whole have put into the cryptocurrency.
When the value of this metric rises, it means the investors are feeding a net amount of capital into the network. On the other hand, it going down suggests the cryptocurrency is facing outflows.
Now, here is the chart shared by Young Ju that shows how the Realized Cap has developed over the history of Bitcoin:
As displayed in the above graph, the Bitcoin Realized Cap saw an acceleration in 2024, implying capital started to enter into the digital asset at a faster rate. In the past year and a half, the metric has seen an explosive growth of $625 billion.
Interestingly, between 2009 and 2024, the Realized Cap cumulatively grew by $435 billion. This means that not only have recent capital flows overtaken these inflows that occurred over a much longer timespan, they have actually gained a notable distance.
The much sharper capital inflows are a reflection of how BTC is growing as an asset. A relatively modest amount of inflows may have been enough to double the asset’s value in the past, but today, a huge amount of capital is needed to move the needle.
A new catalyst for growth this cycle has been in the form of the spot exchange-traded funds (ETFs). These investment vehicles allow investors to gain exposure to Bitcoin without having to own any sats themselves. This has made these funds a popular way to invest for the traditional traders unfamiliar with cryptocurrency wallets and exchanges, and brought in previously untapped capital.
In some other news, on-chain analytics firm Glassnode has shared an update on how Bitcoin investor cohort behavior has recently looked from the lens of the Accumulation Trend Score.
This indicator tells us about whether the BTC holders are buying or selling right now. Below is the chart posted by Glassnode that shows the trend in the metric for the various investor groups.
From the chart, it’s visible that the indicator is in the neutral-to-distribution region for all groups currently, a sign that the Bitcoin investors as a whole are in a phase of selling.
BTC PriceAt the time of writing, Bitcoin is trading around $115,400, up 3% over the last week.
Why this matters
This bitcoin story adds another data point to the current market tape and is useful when read alongside nearby source coverage.
Original source
Read on NewsBTCRelated market context

Bitcoin ETF Inflows Surge Past $1.7 Billion as Holders Return to Profit
US spot Bitcoin ETFs drew over $1.7 billion in two days as Bitcoin cleared the $81,722 average holder cost basis, putting investor...

Trump’s Accounts Put as Much as $100,000 Into Strategy Stock in July, Disclosure Shows
President Donald Trump’s investment accounts put between $50,001 and $100,000 into Strategy stock on July 27, one of several crypt...
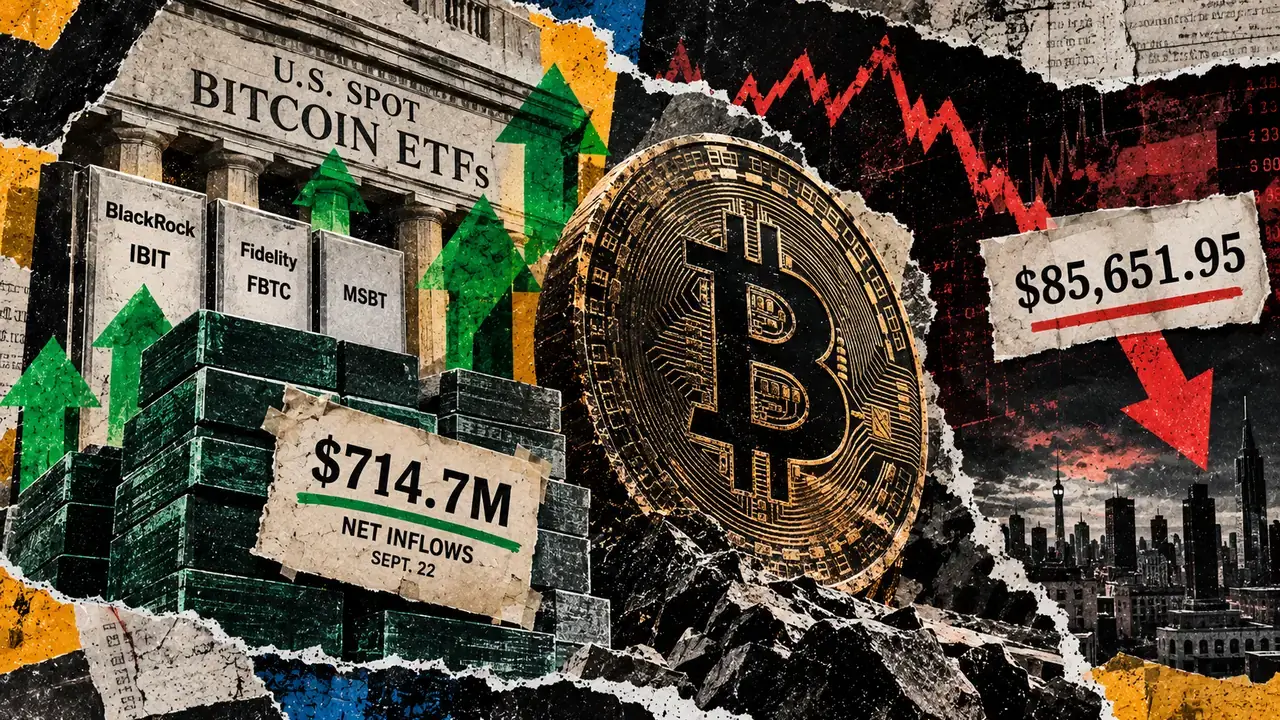
Bitcoin ETFs just erased a $5.7 billion hole, but profit-taking is swallowing the new demand
Bitcoin exchange-traded funds (ETFs) have erased their 2026 flow deficit after a sharp buying revival, even as the top crypto stru...

Hyperliquid (HYPE) Price Prediction: Can Whale Buying and Binance Listing Drive HYPE to $210?
The technical setup for Hyperliquid price currently places $110, $130, $160, and $180 among the key levels to watch, while some tr...
Bitcoin shows near-zero correlation with rising bond yields, diverging sharply from gold
Bitcoin's low correlation with bond yields suggests it may offer unique diversification benefits, challenging traditional asset al...
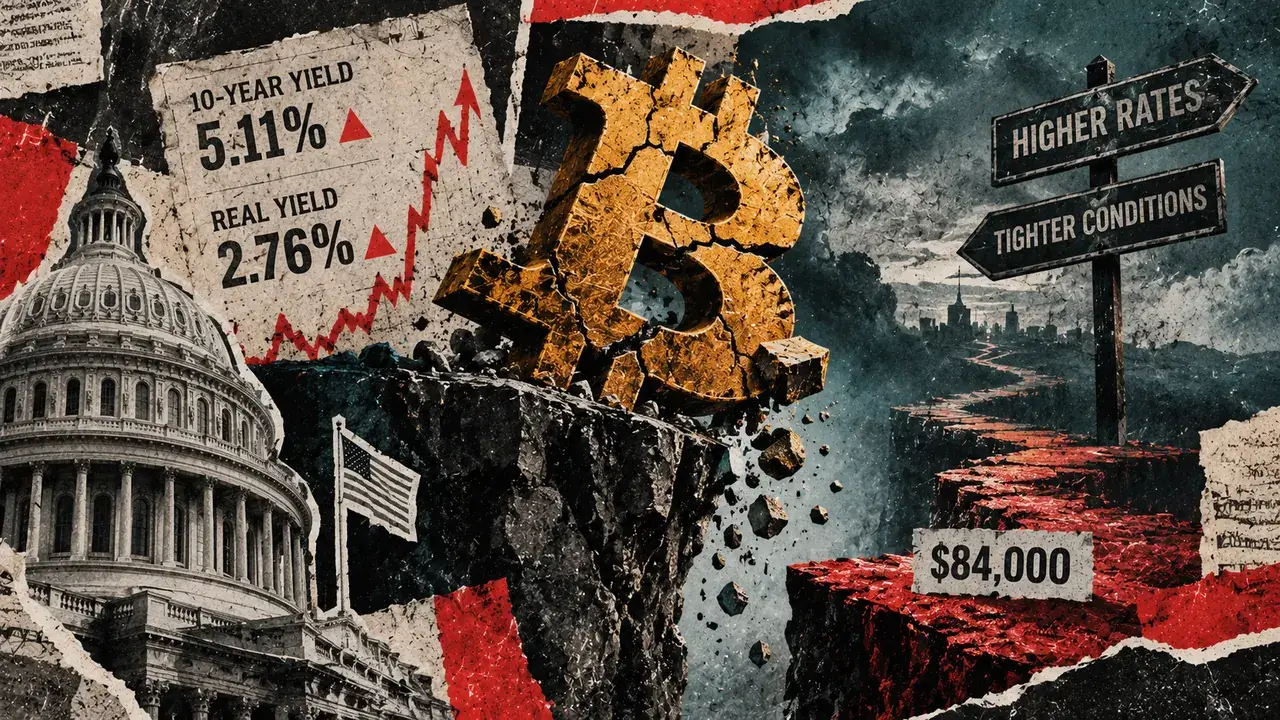
Why surging US real yields are quietly forcing Bitcoin under $84,000
Bitcoin registered an intraday low at $83,500 on Sept. 23, the same day the US 10-year Treasury yield closed at 5.11%, up 15 basis...